
Tata Consultancy Services Limited (TCS) is a leading global IT services, consulting, and business solutions organization, delivering both transformational and outsourcing services to enterprises worldwide. As the flagship company of the Tata Group, TCS operates across key markets—including North America, Latin America, the UK, Europe, Asia-Pacific, India, and the Middle East & Africa. With a workforce of over 607,000 professionals across 55 countries and 180 global delivery centers, TCS leverages its deep domain expertise and global scale to drive client success
| Result Analysis: Tata Consultancy Services Limited
(CMP: Rs. 3,291) |
Result Update: Q1FY26 |
| Stock Details | |
| Market Cap. (Cr.) | 11,90,640 |
| Equity (Cr.) | 362 |
| Face Value | 1 |
| 52 Wk. high/low | 4592/3056 |
| BSE Code | 532540 |
| NSE Code | TCS |
| Book Value (Rs) | 260.08 |
| Sector | IT – Software |
| Key Ratios | |
| ROCE (%): | 64.41 |
| ROE (%): | 52.94 |
| TTM EPS: | 136.19 |
| P/BV: | 12.65 |
| TTM P/E: | 24.16 |
| D/E | 0.09 |
Result Highlights:
- The company reported revenue from operations of Rs 63,437 crore in Q1 FY26, reflecting a YoY growth of 1.3% compared to Rs 62,613 crore in Q1 FY25. However, on a QoQ basis, revenue declined by 1.62% from Rs 64,479 crore in Q4FY25.
- TCS has reported EBIT of Rs 15,514 crore in Q1 FY26, registering a YoY growth of 0.47% compared to Rs 15,442 crore in Q1 FY25. However, EBIT declined by 0.56% on a QoQ basis from Rs 15,601 crore in Q4 FY25. The EBIT margin stood at 23.83% in Q1 FY26, down from 24.29% in Q1 FY25 on a YoY basis, but marginally higher than 23.82% in Q4 FY25.
- It has reported a Profit After Tax of Rs 12,819 crore in Q1 FY26, representing a YoY increase of 5.9% compared to Rs 12,105 crore in Q1 FY25. On a QoQ basis, PAT also rose by 4.3% from Rs 12,293 crore in Q4 FY25. The growth in PAT was primarily driven by an increase in other income.
- The company reported a Last Twelve Months (LTM) attrition rate of 13.8% in Q1 FY26, an increase from 13.3% in Q4 FY25, indicating a slight rise in employee turnover during the quarter.
- TCS reported an order book Total Contract Value of $9.4 billion in Q1 FY26, marking a decline from $12.2 billion in Q4 FY25. Of the total, North America contributed $4.4 billion, while the BFSI and Consumer Business segments accounted for $2.5 billion and $1.6 billion, respectively, indicating continued traction across key markets and verticals despite the sequential dip.
- In Q1 FY26, BFSI remained the highest revenue contributor at 32%, up 1% from 30.9% in Q1 FY25. Consumer Business accounted for 15.6%, Life Sciences & Healthcare 10.2%, Technology & Services 8.4%, Communication & Media 5.8%, Manufacturing 8.7%, Energy, Resources & Utilities 5.9%, and Regional Markets & Others 13.4%. Notably, Technology & Services and BFSI segments recorded growths of 1.8% and 1%, respectively, while all other segments experienced a decline compared to the previous year.
- In Q1 FY26, North America contributed 48.7% to the company’s revenue, reflecting a 2.7% year-on-year decline. The UK and Continental Europe accounted for 18.0% and 15.0%, respectively, both registering slight decreases. Asia Pacific’s contribution rose 3.6% to 8.4%, while India’s share declined 21.7% to 5.8%.
Financial Performance:
Shareholding Pattern:
| Particulars (In %) | Q4FY25 | Q4FY24 |
| Promoter | 71.77 | 71.77 |
| FIIs | 12.04 | 12.70 |
| DIIs | 11.49 | 11.61 |
| Public and Other | 4.63 | 4.86 |
| Government | 0.06 | 0.06 |
Management Commentary:
- The company has declared a dividend of Rs 11 per share for Q1 FY26, with the record date set for July 16, 2025, and the payment scheduled to be made on August 4, 2025.
- Krithivasan, CEO and MD, noted that ongoing macroeconomic and geopolitical uncertainties led to demand softness. However, new service lines performed well, and deal closures were strong. He emphasized the company’s continued focus on supporting clients through cost optimization, vendor consolidation, and AI-driven business transformation amid these challenges.
- The company continued to invest in long-term sustainable growth during the quarter. By remaining agile and responsive to a dynamic environment, it delivered stable margins. Its industry-leading profitability and strong cash conversion position the company well to pursue strategic investments and drive future growth.
Outlook:
Despite ongoing macroeconomic and geopolitical headwinds, the company remains confident in its long-term growth prospects. With steady margins, strong cash conversion, and continued investments in innovation, TCS is well-positioned to capitalize on emerging opportunities. The company expects demand to gradually recover as clients increasingly focus on cost optimization, vendor consolidation, and AI-led transformation. Growth in new services and strong deal closures in Q1 FY26 provide a solid foundation for the coming quarters. While near-term demand softness may persist, TCS’s diversified portfolio, strong client relationships, and strategic focus on digital and AI solutions are expected to drive sustainable value creation and long-term shareholder returns. The company reported an TTM EPS of Rs 136.19 in FY25, and the stock is currently trading at a TTM P/E of 24.16x and P/B of 12.65x.
Results:
| Particulars | Q1FY26 | Q1FY25 | Q4FY25 | YoY% | QoQ% | FY25 | FY24 | VAR[%] |
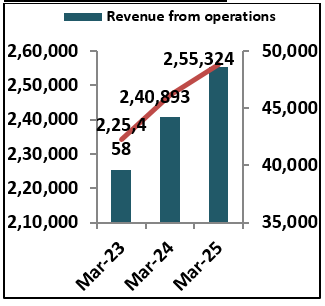
| Gross Sales | 63437 | 62613 | 64479 | 1.3 | -1.6 | 255324 | 240893 | 6.0 |
| Net Sales | 63437 | 62613 | 64479 | 1.3 | -1.6 | 255324 | 240893 | 6.0 |
| Other Income | 1660 | 962 | 1028 | 72.6 | 61.5 | 3962 | 4422 | -10.4 |
| Total Income | 65097 | 63575 | 65507 | 2.4 | -0.6 | 259286 | 245315 | 5.7 |
| Total Expenditure | 46562 | 45951 | 47499 | 1.3 | -2.0 | 187917 | 177555 | 5.8 |
| EBITDA | 18535 | 17624 | 18008 | 5.2 | 2.9 | 71369 | 67760 | 5.3 |
| Interest | 195 | 173 | 227 | 12.7 | -14.1 | 796 | 778 | 2.3 |
| EBTD | 18340 | 17451 | 17781 | 5.1 | 3.1 | 70573 | 66982 | 5.4 |
| Depreciation | 1361 | 1220 | 1379 | 11.6 | -1.3 | 5242 | 4985 | 5.2 |
| EBT | 16979 | 16231 | 16402 | 4.6 | 3.5 | 65331 | 61997 | 5.4 |
| Tax | 4163 | 4290 | 4325 | -3.0 | -3.7 | 16910 | 15864 | 6.6 |
| Deferred Tax | -3 | -164 | -216 | 98.2 | -98.6 | -376 | 34 | -1205.9 |
| PAT | 12819 | 12105 | 12293 | 5.9 | 4.3 | 48797 | 46099 | 5.9 |
Segmental Revenue
| SEGMENT REVENUE | Q1FY26 | Q1FY25 | Q4FY25 | YoY% | QoQ% |
| Banking, Financial Services and Insurance | 24736 | 23074 | 24257 | 7.2 | 2.0 |
| Manufacturing | 6401 | 6271 | 6395 | 2.1 | 0.1 |
| Consumer Business | 10155 | 9991 | 10146 | 1.6 | 0.1 |
| Communication, Media and Technology | 9436 | 10794 | 11022 | -12.6 | -14.4 |
| Life Sciences and Healthcare | 6422 | 6909 | 6491 | -7.0 | -1.1 |
| Others | 6287 | 5574 | 6168 | 12.8 | 1.9 |
Geographical Revenue
| Geography | Q1 FY26 | Q1 FY25 | YoY% CC grwoth |
| Americas | |||
| North America | 49.5 | 48.7 | -2.7 |
| Latin America | 1.9 | 1.9 | 3.5 |
| Europe | |||
| UK | 16.9 | 18 | -1.3 |
| Continental Europe | 14.4 | 15 | -3.1 |
| Asia Pacific | 7.8 | 8.4 | 3.6 |
| India | 7.5 | 5.8 | -21.7 |
| MEA | 2 | 2.2 | 9.4 |
Source: Company website, EWL Research
Disclosure in pursuance of Section 19 of SEBI (RA) Regulation 2014
Elite Wealth Limited does/does not do business with companies covered in its research reports. Investors should be aware that the Elite Wealth Limited may/may not have a conflict of interest that could affect the objectivity of this report. Investors should consider this report as only information in making their investment decision and must exercise their own judgment before making any investment decision.
For analyst certification and other important disclosures, see the Disclosure Appendix, or go to www.elitewealth.in. Analysts employed by Elite Wealth Limited are registered/qualified as research analysts with SEBI in India.( SEBI Registration No.: INH100002300)
Disclosure Appendix
Analyst Certification (For Reports)
Vindhyachal Prasad, Elite Wealth Limited, vindhyachal@elitestock.com
The analyst(s) certify that all of the views expressed in this report accurately reflect my/our personal views about the subject company or companies and its or their securities. I/We also certify that no part of my compensation was, is or will be, directly or indirectly, related to the specific recommendations or views expressed in this report. Unless otherwise stated, the individuals listed on the cover page of this report are analysts in Elite Wealth Limited.
As to each individual report referenced herein, the primary research analyst(s) named within the report individually certify, with respect to each security or issuer that the analyst covered in the report, that:
- all of the views expressed in the report accurately reflect his or her personal views about any and all of the subject securities or issuers; and
- no part of any of the research analyst’s compensation was, is, or will be directly or indirectly related to the specific recommendations or views expressed in the For individual analyst certifications, please refer to the disclosure section at the end of the attached individual notes.
Research Excerpts
This note may include excerpts from previously published research. For access to the full reports, including analyst certification and important disclosures, investment thesis, valuation methodology, and risks to rating and price targets, please visit www.elitewealth.in.
Company-Specific Disclosures
Important disclosures, including price charts, are available and all Elite Wealth Limited covered companies by visiting https://www.elitewealth.in, or emailing research@elitestock.com with your request. Elite Wealth Limited may screen companies based on Strategy, Technical, and Quantitative Research. For important disclosures for these companies, please e-mail research@elitestock.com.
Options related research:
If the information contained herein regards options related research, such information is available only to persons who have received the proper option risk disclosure documents. For a copy of the risk disclosure documents, please contact your Broker’s Representative or visit the OCC’s website at https://www.elitewealth.in
Other Disclosures
All research reports made available to clients are simultaneously available on our client websites. Not all research content is redistributed, e-mailed or made available to third-party aggregators. For all research reports available on a particular stock, please contact your respective broker’s sales person.
Ownership and material conflicts of interest Disclosure
Elite Wealth Limited policy prohibits its analysts, professionals reporting to analysts from owning securities of an y company in the analyst’s area of coverage. Analyst compensation: Analysts are salary based permanent employees of Elite Wealth Limited. Analyst as officer or director: Elite Wealth Limited policy prohibits its analysts, persons reporting to analysts from serving as an officer, director, board member or employee of any company in the analyst’s area of coverage.
Country Specific Disclosures
India – For private circulation only, not for sale. Legal Entities Disclosures
Mr. Ravinder Parkash Seth is the Managing Director of Elite Wealth Ltd (EWL, henceforth), having its registered office at Casa Picasso, Golf Course Extension, Near Rajesh Pilot Chowk, Radha Swami, Sector-61, Gurgaon-122001 Haryana, is a SEBI registered Research Analyst and is regulated by Securities and Exchange Board of India. Telephone: 011-43035555, Facsimile: 011-22795783 and Website: www.elitewealth.in
EWL discloses all material information about itself including its business activity, disciplinary history, the terms and conditions on which it offers research report, details of associates and such other information as is necessary to take an investment decision, including the following:
- Reports
- a) EWL or his associate or his relative has no financial interest in the subject company and the nature of such financial interest;
- EWL or its associates or relatives, have no actual/beneficial ownership of one %. or more in the securities of the subject company, at the end of the month immediately preceding the date of publication of the research report or date of the public appearance;
- EWL or its associate or his relative, has no other material conflict of interest at the time of publication of the research report or at the time of public appearance;
- Compensation
- EWL or its associates have not received any compensation from the subject company in the past twelve months;
- EWL or its associates have not managed or co-managed public offering of securities for the subject company in the past twelve months;
- EWL or its associates have not received any compensation for investment banking or merchant banking or brokerage services from the subject company in the past twelve months;
- EWL or its associates have not received any compensation for products or services other than investment banking or merchant banking or brokerage services from the subject company in the past twelve months;
- EWL or its associates have not received any compensation or other benefits from the Subject Company or third party in connection with the research 3 In respect of Public Appearances
- EWL or its associates have not received any compensation from the subject company in the past twelve months;
- The subject company is not now or never a client during twelve months preceding the date of distribution of the research report and the types of services provided by EWL


