
| Result Analysis: Tata Consultancy Services Ltd. | Result Update: Q3FY23 |
Tata Consultancy Services is the largest IT Company in India and the global leader in IT services, consulting and business solutions with an extensive global network. The company offers a consulting-led, cognitive powered, integrated portfolio of business, technology and engineering services and solutions. It provides services to industries such as BFSI, manufacturing, telecommunications, retail and transportation. The company serves to the world’s biggest conglomerates like Google, Amazon, Apple, IBM, Bosch, Adobe etc.
Result Highlights:
-
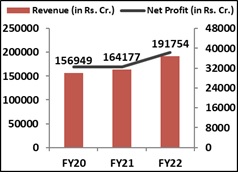
Revenue of the company increased by 19.1% YoY and 5.3% QoQ to Rs.58,229 cr. as against the broader estimates of Rs.57,205 cr.
-
Operating profit margin improved sequentially to 24.5% vs 24% in Q2FY23.
-
Net Profit increased by 3.98% QoQ (despite current global headwinds) to Rs.10,846 cr. compared to the estimates of Rs.11,083 cr.
-
Reported strong net Cash from Operations in the Q3FY23 at Rs.11,154 cr. which is 102.84% of the net profit.
-
Among industries Manufacturing grew 5%, BFSI grew 4.9%, Retail & CPG grew 4.56%, Communications & Media grew 4.24% and Life Sciences & Healthcare grew 5.92% sequentially.
-
Major markets i.e. North America showed degrowth of 0.89% while Europe grew 2.41% quarterly; Asia-pacific showed decline of 1.25% sequentially while Middle East showed major decline of 5.26%. India was at par compared to previous quarter.
-
Order book of TCS is at $7.8 billion, within the range of 7bn-8bn of management guidance vs $8.1 billion in the previous quarter.
-
Attrition rate dropped after the sequential uptick from last six quarters to 21.3% from the previous 21.5%.
-
Net headcount addition declined first time since the pandemic by 2,197; total workforce stood at 6,13,974.
-
Announced total dividend of Rs.75/share which includes special dividend of Rs.67 and interim dividend of Rs.8/share.
Management Commentary:
-
Commenting on December quarter results, Rajesh Gopinathan, CEO and MD said, we are pleased with our strong growth in a seasonally weak quarter, driven by cloud services, market share gains through vendor consolidation, and continued momentum in North America and UK. Looking ahead, and beyond current uncertainties, our longer-term growth outlook remains robust.
-
Samir Seksaria, CFO, said, improved productivity, currency support and abating supply side challenges helped expand our operating margin in Q3. This gives us greater confidence in our ability to steer our profitability towards our preferred range, while continuing to invest in building newer capabilities to support our growth and market share gains.
| Stock Details | |
| Market Cap. (Cr.) | 1214695.25 |
| Face Value | 1.00 |
| Equity (Cr.) | 365.91 |
| 52 Wk. high/low | 4046 / 2926 |
| BSE Code | 532540 |
| NSE Code | TCS |
| Book Value (Rs) | 265 |
| Sector | IT – Software |
| Key Ratios | |
| Debt-equity: | 0.09 |
| ROCE (%): | 53.97 |
| ROE (%): | 44.13 |
| EPS: | 108.24 |
| P/BV: | 12.5 |
| P/E: | 30.67 |
[/vc_column_text][/vc_column_inner][/vc_row_inner]
Shareholding Pattern:
| Shareholding Pattern | |
| Promoters & Promoter Group | 72.27% |
| Others | 27.73% |
Financial Performance:
Results:
| Particulars (In Rs. Cr.) | Q3FY23 | Q2FY23 | Q3FY22 | QoQ % | YoY% |
| Revenue from Operations | 58,229 | 55,309 | 48,885 | 5.28% | 19.11% |
| Other Income | 520 | 965 | 1,205 | -46.11% | -56.85% |
| Total Income | 58,749 | 56,274 | 50,090 | 4.40% | 17.29% |
| Employee Benefit Expenses | 32,467 | 31,041 | 27,168 | 4.59% | 19.50% |
| Employee benefit Expenses as % of Sales | 55.76% | 56.12% | 55.58% | -36bps | 18bps |
| EBIT | 14,284 | 13,279 | 12,237 | 7.57% | 16.73% |
| EBIT Margin (%) | 24.53% | 24.01% | 25.03% | 52bps | -50bps |
| Profit After Tax | 10,846 | 10,431 | 9,769 | 3.98% | 11.02% |
| PATM (%) | 18.63% | 18.86% | 19.98% | -23bps | -135bps |
| EPS (in Rs.) | 29.64 | 28.51 | 26.41 | 3.96% | 12.23% |
| Segment Revenue (In Rs. Cr.) | Q3FY23 | Q2FY23 | Q3FY22 | QoQ % | YoY% |
| BFSI | 22,145 | 21,110 | 18,998 | 4.90% | 16.56% |
| Manufacturing | 5,428 | 5,170 | 4,722 | 4.99% | 14.95% |
| Retail and – Consumer Business | 9,661 | 9,240 | 7,852 | 4.56% | 23.04% |
| Communication, Media and Technology | 9,753 | 9,356 | 8,254 | 4.24% | 18.16% |
| Life Sciences and Healthcare | 6,354 | 5,999 | 5,169 | 5.92% | 22.93% |
| Others | 4,888 | 4,434 | 3,890 | 10.24% | 25.66% |
| Geography Revenue | Q3FY23 | Q2FY23 | Q3FY22 | QoQ % | YoY% |
| America | 55.5 | 56.0 | 52.4 | -0.89% | 5.92% |
| Europe | 29.7 | 29.0 | 31.6 | 2.41% | -6.01% |
| Asia Pacific | 7.9 | 8.0 | 8.6 | -1.25% | -8.14% |
| India | 5.1 | 5.1 | 5.5 | – | -7.27% |
| MEA | 1.8 | 1.9 | 1.9 | -5.26% | -5.26% |
| Segment Revenue % | Q3FY23 | Q2FY23 | Q3FY22 |
| BFSI | 38.03% | 38.17% | 38.86% |
| Manufacturing | 9.32% | 9.35% | 9.66% |
| Retail and – Consumer Business | 16.59% | 16.71% | 16.06% |
| Communication, Media and Technology | 16.75% | 16.92% | 16.88% |
| Life Sciences and Healthcare | 10.91% | 10.85% | 10.57% |
| Others | 8.39% | 8.02% | 7.96% |
| Total | 100.00% | 100.00% | 100.00% |
Conference call Highlights:
-
All verticals performed well with regional markets up 7.3% QoQ, manufacturing is doing better than expected.
-
Performance in revenue and profits can be seen through strong customer portfolio, number of customers who contribute US$ 100M+ rose by 1 to 59 customers YoY basis.
-
Total order book remains in the range of 7-9bn as provided but is sequentially down. US deal pipelines remain strong and positive but UK and Europe regions are creating challenging environment because of the less IT spending.
-
Realization both on a QoQ basis as well as YoY basis is improving and expecting this trend to continue.
-
TCS is seeing an uptick in vendor consolidation deals as clients prefer full service offerings; seeing more consolidation in pipelined deals in areas such as BFSI, healthcare and telecom.
-
Clients are focusing on cloud transformation and the company saw several cloud transformation deals in the quarter.
-
Attrition rate has peaked out previously and has declined slightly in the quarter; confident of this declining trend to continue.
-
Margin improved sequentially due to the ease in elevated expectation of salaries and the backfilling retention expenses.
-
Steadily improving margins and expressed focus on exiting Q4 at 25% also confident in meeting medium-term double-digit growth targets.
Outlook:
TCS showed Q3FY23 result as per street expectations despite seasonally weak quarter; Overall segments of the company grew in the range of 5%-10%. While in the geographies, UK and Europe showed yearly degrowth representing the current slowdown in overall IT spending. Going forward Europe still presents challenging environment for the company for the FY24. Further quarters would give the clear picture regarding the global outlook. The softening order inflow including declining hiring trend as well as cautionary commentary on specific markets from the management points out to the moderating growth in FY24. Although overall medium to long term path for IT spending is strong and being one of the leader in the sector TCS would be the key beneficiary. Hence we remain positive for the company over a longer horizon
Source: Company website, EWL Research
Disclosure in pursuance of Section 19 of SEBI (RA) Regulation 2014
Elite Wealth Limited does/does not do business with companies covered in its research reports. Investors should be aware that the Elite Wealth Limited may/may not have a conflict of interest that could affect the objectivity of this report. Investors should consider this report as only information in making their investment decision and must exercise their own judgment before making any investment decision.
For analyst certification and other important disclosures, see the Disclosure Appendix, or go to www.elitewealth.in. Analysts employed by Elite Wealth Limited are registered/qualified as research analysts with SEBI in India.( SEBI Registration No.: INH100002300)
Disclosure Appendix
Analyst Certification (For Reports)
Israil Khan, Elite Wealth Limited, suhail@elitewealth.in
The analyst(s) certify that all of the views expressed in this report accurately reflect my/our personal views about the subject company or companies and its or their securities. I/We also certify that no part of my compensation was, is or will be, directly or indirectly, related to the specific recommendations or views expressed in this report. Unless otherwise stated, the individuals listed on the cover page of this report are analysts in Elite Wealth Limited.
As to each individual report referenced herein, the primary research analyst(s) named within the report individually certify, with respect to each security or issuer that the analyst covered in the report, that:
(1) all of the views expressed in the report accurately reflect his or her personal views about any and all of the subject securities or issuers; and
(2) no part of any of the research analyst’s compensation was, is, or will be directly or indirectly related to the specific recommendations or views expressed in the report.
For individual analyst certifications, please refer to the disclosure section at the end of the attached individual notes.
Research Excerpts
This note may include excerpts from previously published research. For access to the full reports, including analyst certification and important disclosures, investment thesis, valuation methodology, and risks to rating and price targets, please visit www.elitewealth.in.
Company-Specific Disclosures
Important disclosures, including price charts, are available and all Elite Wealth Limited covered companies by visiting https://www.elitewealth.in, or emailing research@elitestock.com with your request. Elite Wealth Limited may screen companies based on Strategy, Technical, and Quantitative Research. For important disclosures for these companies, please e-mail research@elitestock.com.
Options related research:
If the information contained herein regards options related research, such information is available only to persons who have received the proper option risk disclosure documents. For a copy of the risk disclosure documents, please contact your Broker’s Representative or visit the OCC’s website at https://www.elitewealth.in
Other Disclosures
All research reports made available to clients are simultaneously available on our client websites. Not all research content is redistributed, e-mailed or made available to third-party aggregators. For all research reports available on a particular stock, please contact your respective broker’s sales person.
Ownership and material conflicts of interest Disclosure
Elite Wealth Limited policy prohibits its analysts, professionals reporting to analysts from owning securities of any company in the analyst’s area of coverage. Analyst compensation: Analysts are salary based permanent employees of Elite Wealth Limited. Analyst as officer or director: Elite Wealth Limited policy prohibits its analysts, persons reporting to analysts from serving as an officer, director, board member or employee of any company in the analyst’s area of coverage.
Country Specific Disclosures
India – For private circulation only, not for sale.
Legal Entities Disclosures
Mr. Ravinder Parkash Seth is the Managing Director of Elite Wealth Ltd (EWL, henceforth), having its registered office at Casa Picasso, Golf Course Extension, Near Rajesh Pilot Chowk, Radha Swami, Sector-61, Gurgaon-122001 Haryana, is a SEBI registered Research Analyst and is regulated by Securities and Exchange Board of India. Telephone:011-43035555, Facsimile: 011-22795783 and Website: www.elitewealth.in
EWL discloses all material information about itself including its business activity, disciplinary history, the terms and conditions on which it offers research report, details of associates and such other information as is necessary to take an investment decision, including the following:
1. Reports
a) EWL or his associate or his relative has no financial interest in the subject company and the nature of such financial interest;
(b) EWL or its associates or relatives, have no actual/beneficial ownership of one per cent. or more in the securities of the subject company, at the end of the month immediately preceding the date of publication of the research report or date of the public appearance;
(c) EWL or its associate or his relative, has no other material conflict of interest at the time of publication of the research report or at the time of public appearance;
2. Compensation
(a) EWL or its associates have not received any compensation from the subject company in the past twelve months;
(b) EWL or its associates have not managed or co-managed public offering of securities for the subject company in the past twelve months;
(c) EWL or its associates have not received any compensation for investment banking or merchant banking or brokerage services from the subject company in the past twelve months;
(d) EWL or its associates have not received any compensation for products or services other than investment banking or merchant banking or brokerage services from the subject company in the past twelve months;
(e) EWL or its associates have not received any compensation or other benefits from the Subject Company or third party in connection with the research report.
3 In respect of Public Appearances
(a) EWL or its associates have not received any compensation from the subject company in the past twelve months;
(b) The subject company is not now or never a client during twelve months preceding the date of distribution of the research report and the types of services provided by EWL


