
IndusInd Bank is one of the fastest growing private bank in India engaged in providing a wide range of banking products and financial services to corporate and retail clients. It is the fifth largest private bank in India promoted by the Hinduja group. The products and services offered by the bank includes microfinance, personal loans, personal and commercial vehicles loans, credit cards, SME loans. The bank is working with a widespread network of over 2,606 branches and 2,878 ATMs across country.
| Result Analysis: IndusInd Bank
(CMP: Rs.1392.60) |
Result Update: Q1FY24 |
| Stock Details | |
| Market Cap. (Cr.) | 1,08,059 |
| Equity (Cr.) | 775.95 |
| Face Value | 10 |
| 52 Wk. high/low | 1414 / 816 |
| BSE Code | 532187 |
| NSE Code | INDUSINDBK |
| Book Value (Rs) | 704.33 |
| Sector | Banks |
| Key Ratios | |
| ROE (%): | 10.57 |
| TTM EPS: | 95.93 |
| P/BV: | 2.0 |
| TTM P/E: | 14.52 |
Result Highlights:
-
In Q1FY24, IndusInd bank reported a strong increase of 30.3% YoY in the consolidated net profit due to increased core income and lower provisions. Provisions declined by almost 21% YoY.
-
Net Interest Income of the bank grew by 18% YoY to Rs.4,867 cr. while Net Interest Margin slightly improved by 8 bps to 4.29% on YoY basis.
-
Banks’s deposits grew by 14.6% YoY and advances grew by 21.5% YoY with traction in corporate and consumer loans.
-
Growth in the consumer book was widespread, particularly in the utility vehicle (up 44% YoY) and credit cards (up 39% YoY) segments. Micro Financing loans were flat sequentially, due to the cyclical nature of business and the fact that Q1 is often a difficult quarter.
-
CASA deposits has grown by 6% YoY with savings account deposits at Rs.89,097 cr. and current account deposits at Rs.49,343 cr. CASA ratio of the bank declined in the quarter with 300 bps YoY to 40%.
-
Asset quality of the bank has improved with Gross NPA at 1.94% Vs 1.98% QoQ and Net NPA ratio at 0.58% Vs 0.59% QoQ in the quarter. Slippages also declined on quarterly and yearly basis primarily driven by a reduction in slippages within the corporate book
-
Cost to Income ratio has increased to 45.9% in Q1FY24 Vs 44.9% of Q4FY23 and 43.4 of Q1FY23.
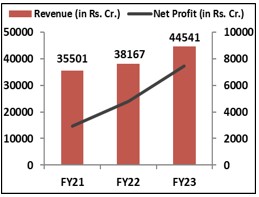
Financial Performance:
Shareholding Pattern:
| Particulars (In %) | Q1FY24 | Q1FY23 |
| Promoters Group | 14.00 | 15.16 |
| FIIs | 52.43 | 51.69 |
| DIIs | 22.67 | 19.30 |
| Public | 7.62 | 9.92 |
| Others | 3.27 | 3.93 |
Management Commentary:
Commenting on June quarter performance, Sumant Kathpalia, Managing Director & CEO, said, The Bank began executing on its next 3-year plan (PC-6) starting Q1 focused on Growth, Granularity and Governance. The Bank maintained healthy loan growth rate of 22% YoY driven by both consumer and corporate segments. The loan growth was supported by retail deposit growth (as per LCR) of 21% YoY and overall deposit growth of 15%. The asset quality metrics too improved this quarter with lower fresh slippages and provisions YoY and QoQ. The Bank thus reported a healthy operating profit of ₹3,831 crores and net profit after tax of ₹2,124 crores growing 30% YoY. Overall, Q1 marks a healthy start to our PC-6 strategy and we remain committed to achieving our ambitions outlined in the plan.
Outlook:
IndusInd bank reported healthy results in the Q1FY24; bank’s operating performance is still on track, with limited provisions and stable NII growth as its major drivers. Fresh slippages in the corporate book are reducing QoQ, while asset quality is stable. According to management’s forecast, loan growth will increase at a rate of 18–23% from FY23 to FY26E. A decrease in credit cost will be made possible by the MFI portfolio’s healthy provisioning and the contingent provisioning buffer of 0.6% of loans, which will support earnings recovery.
Results:
| Particulars (In Rs. Cr.) | Q1FY24 | Q4FY23 | Q1FY23 | QoQ% | YoY% |
| Interest Earned | 10,730 | 10,021 | 8,182 | 7.1% | 31.1% |
| Interest Expended | 5,863 | 5,351 | 4,057 | 9.6% | 44.5% |
| Net Interest Income | 4,867 | 4,669 | 4,125 | 4.2% | 18.0% |
| Operating Profit | 3,831 | 3,758 | 3,431 | 2.0% | 11.7% |
| Provisions | 992 | 1,030 | 1,251 | -3.7% | -20.7% |
| Tax | 715 | 684 | 549 | 4.6% | 30.4% |
| Net Profit after tax | 2,125 | 2,043 | 1,631 | 4.0% | 30.3% |
| Deposits | 3,47,047 | 3,36,120 | 3,02,719 | 3.3% | 14.6% |
| Advances | 3,01,317 | 2,89,924 | 2,47,960 | 3.9% | 21.5% |
| Ratios (%) | Q1FY24 | Q4FY23 | Q1FY23 | QoQ | YoY |
| Gross NPA | 1.94 | 1.98 | 2.35 | -4 bps | -41 bps |
| Net NPA | 0.58 | 0.59 | 0.67 | -1 bps | -9 bps |
| Net Interest Margin | 4.29 | 4.28 | 4.21 | 1 bps | 8 bps |
| Capital Adequacy Ratio | 18.4 | 17.9 | 18.1 | 54 bps | 26 bps |
| Slippages (In Cr.) | 1376 | 1603 | 2250 | -227 | -874 |
| CASA Ratio | 40.0 | 40.0 | 43.0 | – | -300 bps |
Source: Company website, EWL Research
Disclosure in pursuance of Section 19 of SEBI (RA) Regulation 2014
Elite Wealth Limited does/does not do business with companies covered in its research reports. Investors should be aware that the Elite Wealth Limited may/may not have a conflict of interest that could affect the objectivity of this report. Investors should consider this report as only information in making their investment decision and must exercise their own judgment before making any investment decision.
For analyst certification and other important disclosures, see the Disclosure Appendix, or go to www.elitewealth.in. Analysts employed by Elite Wealth Limited are registered/qualified as research analysts with SEBI in India.( SEBI Registration No.: INH100002300)
Disclosure Appendix
Analyst Certification (For Reports)
Kiran Tahlani, Elite Wealth Limited, kirantahlani@elitestock.com
The analyst(s) certify that all of the views expressed in this report accurately reflect my/our personal views about the subject company or companies and its or their securities. I/We also certify that no part of my compensation was, is or will be, directly or indirectly, related to the specific recommendations or views expressed in this report. Unless otherwise stated, the individuals listed on the cover page of this report are analysts in Elite Wealth Limited.
As to each individual report referenced herein, the primary research analyst(s) named within the report individually certify, with respect to each security or issuer that the analyst covered in the report, that:
(1) all of the views expressed in the report accurately reflect his or her personal views about any and all of the subject securities or issuers; and
(2) no part of any of the research analyst’s compensation was, is, or will be directly or indirectly related to the specific recommendations or views expressed in the report.
For individual analyst certifications, please refer to the disclosure section at the end of the attached individual notes.
Research Excerpts
This note may include excerpts from previously published research. For access to the full reports, including analyst certification and important disclosures, investment thesis, valuation methodology, and risks to rating and price targets, please visit www.elitewealth.in.
Company-Specific Disclosures
Important disclosures, including price charts, are available and all Elite Wealth Limited covered companies by visiting https://www.elitewealth.in, or e-mailing research@elitestock.com with your request. Elite Wealth Limited may screen companies based on Strategy, Technical, and Quantitative Research. For important disclosures for these companies, please e-mail research@elitestock.com.
Options related research:
If the information contained herein regards options related research, such information is available only to persons who have received the proper option risk disclosure documents. For a copy of the risk disclosure documents, please contact your Broker’s Representative or visit the OCC’s website at https://www.elitewealth.in
Other Disclosures
All research reports made available to clients are simultaneously available on our client websites. Not all research content is redistributed, e-mailed or made available to third-party aggregators. For all research reports available on a particular stock, please contact your respective broker’s sales person.
Ownership and material conflicts of interest Disclosure
Elite Wealth Limited policy prohibits its analysts, professionals reporting to analysts from owning securities of any company in the analyst’s area of coverage. Analyst compensation: Analysts are salary based permanent employees of Elite Wealth Limited. Analyst as officer or director: Elite Wealth Limited policy prohibits its analysts, persons reporting to analysts from serving as an officer, director, board member or employee of any company in the analyst’s area of coverage.
Country Specific Disclosures
India – For private circulation only, not for sale.
Legal Entities Disclosures
Mr. Ravinder Parkash Seth is the Managing Director of Elite Wealth Ltd (EWL, henceforth), having its registered office at Casa Picasso, Golf Course Extension, Near Rajesh Pilot Chowk, Radha Swami, Sector-61, Gurgaon-122001 Haryana, is a SEBI registered Research Analyst and is regulated by Securities and Exchange Board of India. Telephone: 011-43035555, Facsimile: 011-22795783 and Website: www.elitewealth.in
EWL discloses all material information about itself including its business activity, disciplinary history, the terms and conditions on which it offers research report, details of associates and such other information as is necessary to take an investment decision, including the following:
- Reports
- a) EWL or his associate or his relative has no financial interest in the subject company and the nature of such financial interest;
(b) EWL or its associates or relatives, have no actual/beneficial ownership of one per cent. or more in the securities of the subject company, at the end of the month immediately preceding the date of publication of the research report or date of the public appearance;
(c) EWL or its associate or his relative, has no other material conflict of interest at the time of publication of the research report or at the time of public appearance;
- Compensation
(a) EWL or its associates have not received any compensation from the subject company in the past twelve months;
(b) EWL or its associates have not managed or co-managed public offering of securities for the subject company in the past twelve months;
(c) EWL or its associates have not received any compensation for investment banking or merchant banking or brokerage services from the subject company in the past twelve months;
(d) EWL or its associates have not received any compensation for products or services other than investment banking or merchant banking or brokerage services from the subject company in the past twelve months;
(e) EWL or its associates have not received any compensation or other benefits from the subject company or third party in connection with the research report.
3 In respect of Public Appearances
(a) EWL or its associates have not received any compensation from the subject company in the past twelve months;
(b) The subject company is not now or never a client during twelve months preceding the date of distribution of the research report and the types of services provided by EWL
Provided that research analyst or research entity shall not be required to make a disclosure as per sub-clauses (c), (d) and (e) of clause (ii) or sub-clauses (a) and (b) of clause (iii) to the extent such disclosure would reveal material non-public information regarding specific potential future investment banking or merchant banking or brokerage services transactions of the subject company.
(4) EWL or its proprietor has never served as an officer, director or employee of the subject company;
(5) EWL has never been engaged in market making activity for the subject company;
(6) EWL shall provide all other disclosures in research report and public appearance as specified by the Board under any other regulations.


