
Incorporated in 1999, HDFC Asset Management Company Limited (HDFC AMC) is Investment Manager to HDFC Mutual Fund, one of the largest mutual funds in the country with closing AUM of Rs 7.76 trillion as on December 31, 2024. The Company offers a comprehensive suite of savings and investment products ranging from mutual funds, including both actively managed and passive options, to portfolio management services and alternative investment opportunities catering to the needs of a large and diverse customer base. HDFC AMC proudly serves a mutual fund customer base of 1.26 Crore unique investors, with a total of 2.21 Crore live accounts. The Company has a vast network of 280 offices, over 95,000 distribution partners and modern digital platforms, enabling it to serve clients across India.
| Result Analysis: HDFC AMC (CMP: Rs.3,713) | Result Update: Q3FY25 |
| Stock Details | |
| Market Cap. (Cr.) | 79,380 |
| Equity (Cr.) | 106.88 |
| Face Value | 5 |
| 52 Wk. high/low | 4862 / 3419 |
| BSE Code | 541729 |
| NSE Code | HDFCAMC |
| Book Value (Rs) | 317.84 |
| Sector | Finance & Investments |
| Key Ratios | |
| ROCE (%): | 37.69 |
| ROE (%): | 29.47 |
| TTM EPS: | 110.52 |
| P/BV: | 11.68 |
| TTM P/E: | 33.75 |
Result Highlights:
- Revenue from operations was ₹9,34.3 Crore and operating profit was ₹7,47.2 Crore for the Quarter ended December 31,2024, an increase of 39% and 51% respectively over the Quarter ended December 31,2023.
- Profit before tax for the quarter ended December 31,2024 was ₹8,40 Crore as compared to ₹6,38.5 Crore for the quarter ended December 31,2023. demonstrating improved operational performance and strategic initiatives driving profitability and operational excellence.
- Profit after tax for the quarter ended December 31,2024 was ₹6,41.5 Crore as compared to ₹4,89.6 Crore for the quarter ended December 31,2023 with the growth rate of 03%.
- In Q3FY25, unique logins for Investors and Partners increased by 28% and 14%, respectively, compared to Q3FY24. This growth highlights enhanced engagement and platform adoption, reflecting the continued efforts to deliver value and optimize user experience for both stakeholder groups.
- As of December 31, 2024, the company is rank among India’s largest mutual fund managers, holding an 11.5% QAAUM market share. The company is also a leading player in actively managed equity mutual funds with a 12.8% market share and the preferred choice for individual investors, commanding a 13.2% market share of the individual monthly average AUM.
- Over 95,000 empaneled distribution partners across MFDs, National Distributors and Banks, serviced through a total of 280 offices of which 196 are in B-30 locations. This includes 25 new offices inaugurated on 2nd January 2025. The contribution of B-30 locations to the total monthly average AUM for December 2024 is 19.3%.
- QAAUM in actively managed equity-oriented funds (equity oriented QAAUM) excluding index funds stood at ₹478200 Crore for the quarter ended December 31,2024 with a market share of 12.8%. The AMC is amongst the largest actively managed equity-oriented mutual fund managers in the country.
Financial Performance:
Shareholding Pattern:
| Particulars (In %) | Q3FY25 | Q3FY24 |
| Promoters Group | 52.48 | 52.55 |
| FIIs | 21.32 | 17.99 |
| DIIs | 17.04 | 19.50 |
| Public | 9.15 | 9.96 |
Outlook:
The company has demonstrated strong growth for the quarter ended December 31, 2024, with a 39% increase in revenue to ₹934.3 Crore and a 51% rise in operating profit to ₹747.2 Crore. Profit after tax grew 31.03% to ₹641.5 Crore, reflecting improved operational performance. The company also continues to lead the market, holding an 11.5% QAAUM market share and 12.8% share in actively managed equity mutual funds. With over 95,000 empaneled distribution partners, including a strong presence in B-30 locations, and growing user engagement, the outlook remains positive. The company is well-positioned for sustained growth, driven by its strategic initiatives and robust market presence, offering promising value creation for investors.
Results:
| Particulars (In Rs. Cr.) | Q3FY25 | Q2FY25 | Q3FY24 | QoQ % | YoY % | FY24 | FY23 | YoY % |
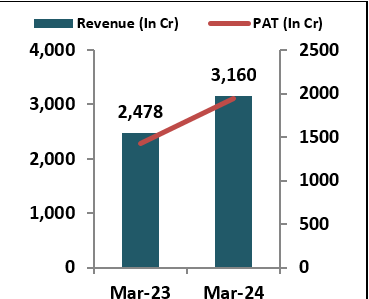
| Sales | 934.63 | 887.21 | 671.32 | 5.3 | 39.2 | 2584.37 | 2166.81 | 19.3 |
| Other Income | 93.09 | 170.98 | 142.86 | -45.6 | -34.8 | 579.02 | 315.81 | 83.3 |
| Total Income | 1027.72 | 1058.19 | 814.18 | -2.9 | 26.2 | 3163.39 | 2482.62 | 27.4 |
| Total Expenditure | 170.75 | 183.77 | 162.1 | -7.1 | 2.1 | 626.95 | 549.53 | 14.1 |
| EBIDT | 856.97 | 874.42 | 652.08 | -2.0 | 24.1 | 2536.44 | 1933.09 | 31.2 |
| Interest | 2.23 | 2.27 | 2.16 | -1.8 | 3.2 | 9.09 | 9.69 | -6.2 |
| EBTD | 854.74 | 872.15 | 649.92 | -2.0 | 20.9 | 2527.35 | 1923.4 | 31.4 |
| Depreciation | 14.89 | 13.74 | 13.09 | 8.4 | 13.8 | 52.33 | 53.34 | -1.9 |
| EBT | 839.85 | 858.41 | 636.83 | -2.2 | 7.1 | 2475.02 | 1870.06 | 32.3 |
| Tax | 198.49 | 281.8 | 148.91 | -29.6 | 58.3 | 532.33 | 446.69 | 19.2 |
| PAT | 641.36 | 576.61 | 487.92 | 11.2 | -51.2 | 1942.69 | 1423.37 | 36.5 |
| Segment Closing AUM (%) | Q3FY25 | Q2FY25 | Q3FY24 | |||
| HDFC MF | Industry | HDFC MF | Industry | HDFC MF | Industry | |
| Equity-oriented | 66 | 58.7 | 67.7 | 59.4 | 63.8 | 55.4 |
| Debt-oriented | 20.2 | 17.8 | 20 | 17.1 | 23.3 | 19.7 |
| Liquid | 9.9 | 8.1 | 8.6 | 7.6 | 9.6 | 8.9 |
| Others | 4 | 15.4 | 3.7 | 15.9 | 3.4 | 15.9 |
Total AUM by Multi – channel Distribution Network:
| Particulars (%) | Q3FY25 | Q2FY25 | Q3FY24 |
| HDFC Bank | 5.7 | 6 | 6 |
| Banks | 10.6 | 11.1 | 11 |
| MFDs | 26.6 | 27.8 | 29.3 |
| National Distributors | 21.3 | 21.3 | 20.9 |
| Direct | 41.4 | 39.8 | 38.8 |
Source: Company website, EWL Research
Disclosure in pursuance of Section 19 of SEBI (RA) Regulation 2014
Elite Wealth Limited does/does not do business with companies covered in its research reports. Investors should be aware that the Elite Wealth Limited may/may not have a conflict of interest that could affect the objectivity of this report. Investors should consider this report as only information in making their investment decision and must exercise their own judgment before making any investment decision.
For analyst certification and other important disclosures, see the Disclosure Appendix, or go to www.elitewealth.in. Analysts employed by Elite Wealth Limited are registered/qualified as research analysts with SEBI in India.( SEBI Registration No.: INH100002300)
Disclosure Appendix
Analyst Certification (For Reports)
Vindhyachal Prasad, Elite Wealth Limited, vindhyachal@elitestock.com
The analyst(s) certify that all of the views expressed in this report accurately reflect my/our personal views about the subject company or companies and its or their securities. I/We also certify that no part of my compensation was, is or will be, directly or indirectly, related to the specific recommendations or views expressed in this report. Unless otherwise stated, the individuals listed on the cover page of this report are analysts in Elite Wealth Limited.
As to each individual report referenced herein, the primary research analyst(s) named within the report individually certify, with respect to each security or issuer that the analyst covered in the report, that:
- all of the views expressed in the report accurately reflect his or her personal views about any and all of the subject securities or issuers; and
- no part of any of the research analyst’s compensation was, is, or will be directly or indirectly related to the specific recommendations or views expressed in the For individual analyst certifications, please refer to the disclosure section at the end of the attached individual notes.
Research Excerpts
This note may include excerpts from previously published research. For access to the full reports, including analyst certification and important disclosures, investment thesis, valuation methodology, and risks to rating and price targets, please visit www.elitewealth.in.
Company-Specific Disclosures
Important disclosures, including price charts, are available and all Elite Wealth Limited covered companies by visiting https://www.elitewealth.in, or emailing research@elitestock.com with your request. Elite Wealth Limited may screen companies based on Strategy, Technical, and Quantitative Research. For important disclosures for these companies, please e-mail research@elitestock.com.
Options related research:
If the information contained herein regards options related research, such information is available only to persons who have received the proper option risk disclosure documents. For a copy of the risk disclosure documents, please contact your Broker’s Representative or visit the OCC’s website at https://www.elitewealth.in
Other Disclosures
All research reports made available to clients are simultaneously available on our client websites. Not all research content is redistributed, e-mailed or made available to third-party aggregators. For all research reports available on a particular stock, please contact your respective broker’s sales person.
Ownership and material conflicts of interest Disclosure
Elite Wealth Limited policy prohibits its analysts, professionals reporting to analysts from owning securities of an y company in the analyst’s area of coverage. Analyst compensation: Analysts are salary based permanent employees of Elite Wealth Limited. Analyst as officer or director: Elite Wealth Limited policy prohibits its analysts, persons reporting to analysts from serving as an officer, director, board member or employee of any company in the analyst’s area of coverage.
Country Specific Disclosures
India – For private circulation only, not for sale. Legal Entities Disclosures
Mr. Ravinder Parkash Seth is the Managing Director of Elite Wealth Ltd (EWL, henceforth), having its registered office at Casa Picasso, Golf Course Extension, Near Rajesh Pilot Chowk, Radha Swami, Sector-61, Gurgaon-122001 Haryana, is a SEBI registered Research Analyst and is regulated by Securities and Exchange Board of India. Telephone: 011-43035555, Facsimile: 011-22795783 and Website: www.elitewealth.in
EWL discloses all material information about itself including its business activity, disciplinary history, the terms and conditions on which it offers research report, details of associates and such other information as is necessary to take an investment decision, including the following:
- Reports
- a) EWL or his associate or his relative has no financial interest in the subject company and the nature of such financial interest;
- EWL or its associates or relatives, have no actual/beneficial ownership of one %. or more in the securities of the subject company, at the end of the month immediately preceding the date of publication of the research report or date of the public appearance;
- EWL or its associate or his relative, has no other material conflict of interest at the time of publication of the research report or at the time of public appearance;
- Compensation
- EWL or its associates have not received any compensation from the subject company in the past twelve months;
- EWL or its associates have not managed or co-managed public offering of securities for the subject company in the past twelve months;
- EWL or its associates have not received any compensation for investment banking or merchant banking or brokerage services from the subject company in the past twelve months;
- EWL or its associates have not received any compensation for products or services other than investment banking or merchant banking or brokerage services from the subject company in the past twelve months;
- EWL or its associates have not received any compensation or other benefits from the Subject Company or third party in connection with the research 3 In respect of Public Appearances
- EWL or its associates have not received any compensation from the subject company in the past twelve months;
- The subject company is not now or never a client during twelve months preceding the date of distribution of the research report and the types of services provided by EWL