
HCLTech is a global technology company, home to more than 220,000 people across 60 countries, delivering industry-leading capabilities centered around digital, engineering, cloud and AI, powered by a broad portfolio of technology services and products. We work with clients across all major verticals, providing industry solutions for Financial Services, Manufacturing, Life Sciences and Healthcare, Technology and Services, Telecom and Media, Retail and CPG, and Public Services.
| Result Analysis: HCL Technology (CMP: Rs.1714.50) | Result Update: Q3FY25 |
| Stock Details | |
| Market Cap. (Cr.) | 4,65,122 |
| Equity (Cr.) | 542.73 |
| Face Value | 2 |
| 52 Wk. high/low | 2012.20/1235 |
| BSE Code | 532281 |
| NSE Code | HCLTECH |
| Book Value (Rs) | 253.81 |
| Sector | Computer-Software |
| Key Ratios | |
| Debt-equity: | 0.08 |
| ROCE (%): | 28.63 |
| ROE (%): | 23.51 |
| TTM EPS: | 62.98 |
| P/BV: | 6.75 |
| TTM P/E: | 27.07 |
Result Highlights:
- Revenue increased by 3.6%, reaching Rs 29,890 crore compared to Rs 28,862 crore, driven by robust performance across key segments and markets, reflecting steady business expansion and a strong market presence.
- Net profit grew 8.4% to Rs 4,594 crore from Rs 4,237 crore, indicating effective cost management and higher operational efficiency, contributing to enhanced profitability despite economic challenges.
- EBIT rose 8.6% to Rs 5,821 crore, with an EBIT margin of 19.5%, up from 18.6%, demonstrating improved operational performance and strategic initiatives driving profitability and operational excellence.
- HCL Technologies reported a 2.2% QoQ and 4.9% YoY growth in Services revenue in constant currency (CC), driven by strong performance across key markets. Digital revenue rose 6.3% YoY CC, now contributing 38.5% of Services revenue, highlighting growth in digital transformation. However, HCL Software faced a 2.1% YoY decline in revenue CC, with ARR standing at $1.02 billion, down 0.6% YoY CC, reflecting stability despite challenges in the software segment.
- 12,600+ employees leveraged HCLTech’s Value Creation Portal in Q3 FY25, generating, reviewing and approving 4,260+ ideas and implementing 2,030+ ideas that delivered customer signed-off value worth $390 million. And 13 patents were filed and 20 were granted in Q3 FY25
- HCLTech strengthened its capabilities in AI-driven contact center transformation by further expanding its strategic partnership with a US-based global technology company to help transform contact centers with generative AI and cloud-based solutions.
Financial Performance:
Shareholding Pattern:
| Particulars (In %) | Q3FY25 | Q3FY24 |
| Promoters Group | 60.82 | 60.82 |
| FIIs | 19.38 | 19.42 |
| DIIs | 15.21 | 15.12 |
| Public | 4.42 | 4.40 |
| Others | 0.13 | 0.21 |
| Govt | 0.04 | 0.02 |
Management Commentary:
- HCLTech is well positioned as AI-led transformation brings new opportunities for growth. The company is continue to deliver industry-leading performance with governance and sustainability at the core.
- Dividend of ₹18/- per share including special dividend of ₹6/- per share to celebrate 25 years of HCLTech’s public listing.
- For FY25, the company has guided a revenue growth of 4.5% to 5% YoY in constant currency (CC). Services revenue is expected to grow within the same range of 4.5% to 5% YoY in CC. The EBIT margin is projected to be between 18% and 19%, reflecting stable profitability and operational efficiency.
Outlook:
HCLTech’s strong performance in Q3 FY25 positions it well for sustained growth, with a revenue increase of 3.6% and robust profitability. The company’s focus on AI-driven solutions and digital transformation continues to drive its success, particularly in services, with digital revenue rising 6.3% YoY. For FY25, HCLTech has guided a revenue growth of 4.5% to 5% YoY in constant currency, along with an EBIT margin between 18% and 19%, ensuring stability and efficiency. The company’s continued focus on innovation, AI, and sustainable growth strategies will support its long-term performance and value creation.
Results:
| Particulars (In Rs. Cr.) | Q3FY25 | Q2FY25 | Q3FY24 | QoQ % | YoY % | FY24 | FY23 | YoY % |
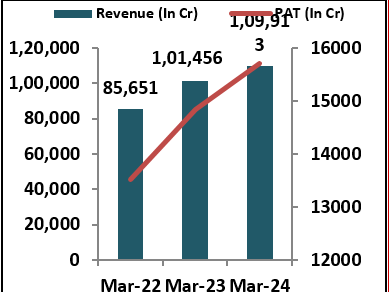
| Sales | 29890 | 28862 | 28446 | 3.6 | 5.1 | 109913 | 101456 | 8.3 |
| Other Income | 477 | 456 | 370 | 4.6 | 28.9 | 1495 | 1358 | 10.1 |
| Total Income | 30367 | 29318 | 28816 | 3.6 | 5.4 | 111408 | 102814 | 8.4 |
| Total Expenditure | 23030 | 22493 | 21659 | 2.4 | 6.3 | 85715 | 78828 | 8.7 |
| EBIDT | 7337 | 6825 | 7157 | 7.5 | 2.5 | 25693 | 23986 | 7.1 |
| Interest | 166 | 131 | 140 | 26.7 | 18.6 | 553 | 353 | 56.7 |
| EBDT | 7171 | 6694 | 7017 | 7.1 | 2.2 | 25140 | 23633 | 6.4 |
| Depreciation | 1039 | 1007 | 1143 | 3.2 | -9.1 | 4173 | 4145 | 0.7 |
| EBT | 6132 | 5687 | 5874 | 7.8 | 4.4 | 20967 | 19488 | 7.6 |
| Tax | 1229 | 1191 | 1348 | 3.2 | -8.8 | 4626 | 4665 | -0.8 |
| PAT | 4594 | 4237 | 4351 | 8.4 | 5.6 | 15710 | 14845 | 5.8 |
| EPS | 16.94 | 15.62 | 16.06 | 8.5 | 5.5 | 57.99 | 54.85 | 5.7 |
| Segment Revenue (%) | Q3FY25 | Q2FY25 | Q3FY24 |
| IT and Business Services | 73 | 74.6 | 71.8 |
| Engineering and R&D Services | 16 | 15.8 | 16.5 |
| HCLSoftware | 11.3 | 9.9 | 12 |
| Inter-Segment | 0.3 | 0.03 | 0.03 |
| Vertical Revenue (%) | Q3FY25 | Q2FY25 | Q3FY24 |
| Financial services | 20.3 | 20.5 | 21.7 |
| Manufacturing | 19.1 | 19.5 | 20.1 |
| Lifesciences & Healthcare | 15.5 | 16 | 16.4 |
| Technology and Services | 13.3 | 13.1 | 12.8 |
| Telecommunications, Media, Publishing & Entertainment | 12.3 | 12.1 | 9.7 |
| Retail & CPG | 10.6 | 9.6 | 9.6 |
| Public Services | 8.9 | 9.2 | 9.7 |
| Geography Revenue (%) | Q3FY25 | Q2FY25 | Q3FY24 |
| America | 65.5 | 65.1 | 64.5 |
| Europe | 28.2 | 28.4 | 29 |
| Rest of the World | 6.3 | 6..5 | 6.4 |
Source: Company website, EWL Research
Disclosure in pursuance of Section 19 of SEBI (RA) Regulation 2014
Elite Wealth Limited does/does not do business with companies covered in its research reports. Investors should be aware that the Elite Wealth Limited may/may not have a conflict of interest that could affect the objectivity of this report. Investors should consider this report as only information in making their investment decision and must exercise their own judgment before making any investment decision.
For analyst certification and other important disclosures, see the Disclosure Appendix, or go to www.elitewealth.in. Analysts employed by Elite Wealth Limited are registered/qualified as research analysts with SEBI in India.( SEBI Registration No.: INH100002300)
Disclosure Appendix
Analyst Certification (For Reports)
Vindhyachal Prasad, Elite Wealth Limited, vindhyachal@elitestock.com
The analyst(s) certify that all of the views expressed in this report accurately reflect my/our personal views about the subject company or companies and its or their securities. I/We also certify that no part of my compensation was, is or will be, directly or indirectly, related to the specific recommendations or views expressed in this report. Unless otherwise stated, the individuals listed on the cover page of this report are analysts in Elite Wealth Limited.
As to each individual report referenced herein, the primary research analyst(s) named within the report individually certify, with respect to each security or issuer that the analyst covered in the report, that:
- all of the views expressed in the report accurately reflect his or her personal views about any and all of the subject securities or issuers; and
- no part of any of the research analyst’s compensation was, is, or will be directly or indirectly related to the specific recommendations or views expressed in the For individual analyst certifications, please refer to the disclosure section at the end of the attached individual notes.
Research Excerpts
This note may include excerpts from previously published research. For access to the full reports, including analyst certification and important disclosures, investment thesis, valuation methodology, and risks to rating and price targets, please visit www.elitewealth.in.
Company-Specific Disclosures
Important disclosures, including price charts, are available and all Elite Wealth Limited covered companies by visiting https://www.elitewealth.in, or emailing research@elitestock.com with your request. Elite Wealth Limited may screen companies based on Strategy, Technical, and Quantitative Research. For important disclosures for these companies, please e-mail research@elitestock.com.
Options related research:
If the information contained herein regards options related research, such information is available only to persons who have received the proper option risk disclosure documents. For a copy of the risk disclosure documents, please contact your Broker’s Representative or visit the OCC’s website at https://www.elitewealth.in
Other Disclosures
All research reports made available to clients are simultaneously available on our client websites. Not all research content is redistributed, e-mailed or made available to third-party aggregators. For all research reports available on a particular stock, please contact your respective broker’s sales person.
Ownership and material conflicts of interest Disclosure
Elite Wealth Limited policy prohibits its analysts, professionals reporting to analysts from owning securities of an y company in the analyst’s area of coverage. Analyst compensation: Analysts are salary based permanent employees of Elite Wealth Limited. Analyst as officer or director: Elite Wealth Limited policy prohibits its analysts, persons reporting to analysts from serving as an officer, director, board member or employee of any company in the analyst’s area of coverage.
Country Specific Disclosures
India – For private circulation only, not for sale. Legal Entities Disclosures
Mr. Ravinder Parkash Seth is the Managing Director of Elite Wealth Ltd (EWL, henceforth), having its registered office at Casa Picasso, Golf Course Extension, Near Rajesh Pilot Chowk, Radha Swami, Sector-61, Gurgaon-122001 Haryana, is a SEBI registered Research Analyst and is regulated by Securities and Exchange Board of India. Telephone: 011-43035555, Facsimile: 011-22795783 and Website: www.elitewealth.in
EWL discloses all material information about itself including its business activity, disciplinary history, the terms and conditions on which it offers research report, details of associates and such other information as is necessary to take an investment decision, including the following:
- Reports
- a) EWL or his associate or his relative has no financial interest in the subject company and the nature of such financial interest;
- EWL or its associates or relatives, have no actual/beneficial ownership of one %. or more in the securities of the subject company, at the end of the month immediately preceding the date of publication of the research report or date of the public appearance;
- EWL or its associate or his relative, has no other material conflict of interest at the time of publication of the research report or at the time of public appearance;
- Compensation
- EWL or its associates have not received any compensation from the subject company in the past twelve months;
- EWL or its associates have not managed or co-managed public offering of securities for the subject company in the past twelve months;
- EWL or its associates have not received any compensation for investment banking or merchant banking or brokerage services from the subject company in the past twelve months;
- EWL or its associates have not received any compensation for products or services other than investment banking or merchant banking or brokerage services from the subject company in the past twelve months;
- EWL or its associates have not received any compensation or other benefits from the Subject Company or third party in connection with the research 3 In respect of Public Appearances
- EWL or its associates have not received any compensation from the subject company in the past twelve months;
- The subject company is not now or never a client during twelve months preceding the date of distribution of the research report and the types of services provided by EWL