
| Recommendation | CMP | Target Price | Time Horizon |
| Accumulate | Rs. 685 | Rs. 905 | 12 Months |
Tata Consumer Products own the well-loved brands – Tata Tea, Tetley, Tata Salt, Eight O’Clock Coffee, Himalayan Water and emerging brands like Tata Sampann, Tata Soulfull, Tata Gluco Plus and Tata Water Plus. It has significant market presence and leadership position in many global markets. Tata Tea is 2nd Largest Tea Brand in India and Tetley is the 4th largest tea brand in UK & largest tea brand in Canada with 28.2% market share. Teapigs is the super premium brand in the UK with 67% market share. Tata Consumer Out-of-home retail comprises tea-cafes and premium cafes in partnership with Starbucks in India.
Stock Details |
|
| Market Cap. (Cr.) | 65485.46 |
| Face Value | 1.00 |
| Equity (Cr.) | 92.16 |
| 52 Wk. high/low | 889.00/564.45 |
| BSE Code | 500800 |
| NSE Code | TATACONSUM |
| Book Value (Rs) | 158.11 |
| Industry | Tea |
| P/E | 82.8 |
Share Holding Pattern % |
|
Promoter |
34.68 |
| FIIs | 26.81 |
| Institutions | 13.39 |
| Non Promoter Corp. | 1.62 |
| Public & Others
Government |
23.49
0.01 |
| Total | 100.00 |
Price Chart
Key Investment Rationale:
-
In November 2021, Tata consumer acquired 100% stake in Tata SmartFoodz for Rs. 395 Cr. in a strategic move to expand into value added categories. Acquisition of Tata Q brand will help the company to foray into the higher margin Ready-to-Eat (RTE) category. Besides expansion of its product portfolio, the company is expected to benefit from the rapid pace of growth in the RTE segment.
-
Tata Sampann and Nourishco brands of the company registered strong volume growth of 39% and 100% plus YoY respectively during Q3FY22. Company launched Tata Fruski in new markets, and Tata Nature Alive, a premium mineral water product in select markets in the north.
-
Tata Consumer had a decent third quarter in FY22 with 6% top line, 28% EBITDA and 22% net profit growth despite a high base of the previous year which was up by 23% YoY
-
Despite the inflationary pressure Company was able to improve its margin with EBITDA margin expended from 13.9% in Q2FY22 to 14.6% Q3FY22.
-
Tata consumer is gaining market share in the core categories of tea and salt with 476 bps YoY market share increase in salt and 89 bps YoY increases in branded tea category during Q3FY22.
-
Tata Starbucks recorded revenue growth of 60% YoY in Q3 on a relatively low base of last year due to Covid. Compare to the same period in FY20 revenue grew 37%. It opened 13 new stores between October and December and entered two new cities. With the reduction of Covid cases each day, Footfall of customer in Starbucks will also increase.
Outlook:
Tata Consumer Products Limited is a fast-growing food and beverage Company, with second largest presence in Tea globally and leadership position in Salt category in India. The company is undertaking product innovations and investing in its brands which are expected to improve its operating profitability in the future. At the consolidated level TCPL’s capital structure remains comfortable with Debt to Equity Ratio of 0.05 at the end of September, 2021. On performance front we expect company to report EPS of Rs.11.2 for FY23E, at CMP of Rs.685 PE works out to be 61.1x. Hence, investors can accumulate the stock between Rs.600 – Rs.650 for the target price of Rs.905. Time frame should be 9-12months.
Brands:
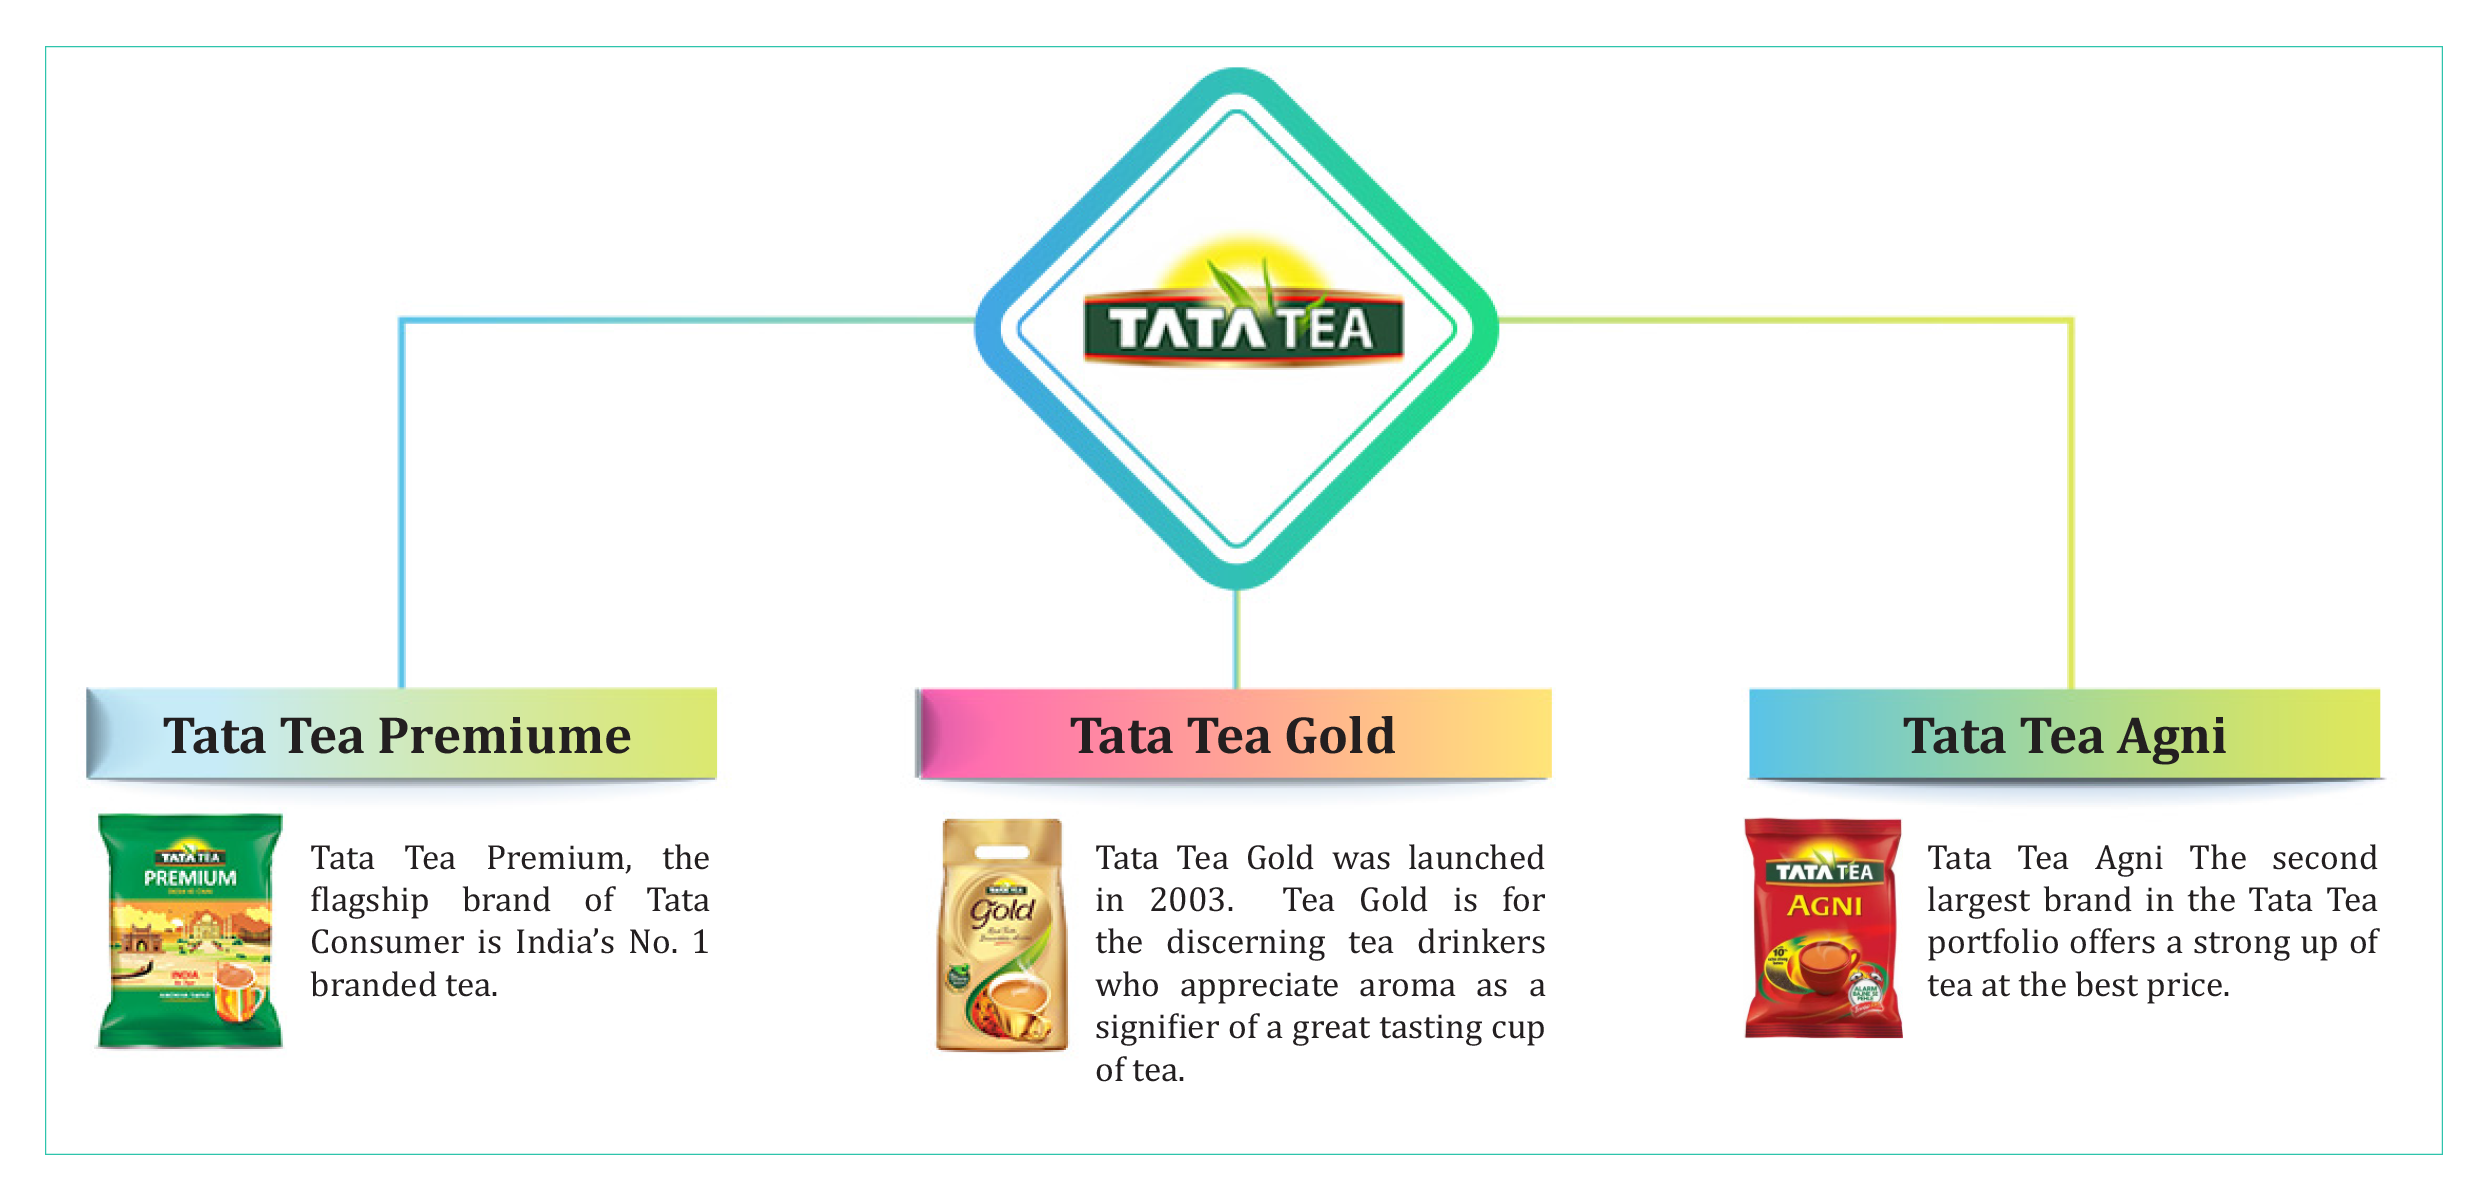
Leading Tea Brands:
BrandsGood Earth – International presence
Teapigs – 67% market share in UK
Leading Coffee Brands:
Eight O’Clock Coffee – largest coffee R & G brand in USA
Tata Coffee Grand leverages the deep heritage of Tata in coffee
Leading Beverages Brands: In May 2020, Tata Consumer Products acquired PepsiCo’s stake in NourishCo Beverages Limited—a 50:50 joint venture between the two companies that housed brands such as Himalaya packaged water and GlucoPlus.
Himalayan Natural Mineral Water – #1 natural mineral water brand
Tata Gluco
Tata Fruski
Tata Copper Plus Water
Good Earth
Tata Nature Alive – Launch of Mass Premium Natural Mineral Water
Leading Food Brands:
Tata Salt – Largest salt brand in India Premium portfolio value contribution grew 3.5% in FY 20-21 (1.8% in FY 19-20
Tata Sampann – National brand in pulses, spices and mixes . Strengthened leadership in branded Poha category on E- Commerce channels by driving consumer upgradation and conversion to the larger pack SKU and building consumer stickiness
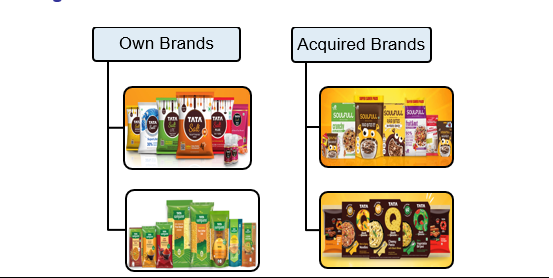
Tata Soulfull – In FY21, acquire a 100% stake in Kottaram Agro Foods—the maker of Soulfull brand of breakfast cereals and millet-based snacks. It is among the fastest growing in India’s ‘better For you’ packaged foods market.
Tata Q- In line with strategic priority of exploring new opportunities for growth, TCPL acquired Tata SmartFoodz Ltd. (TSFL), the owner of the brand “Tata Q” in November’21. Tata Q brand will help the company to foray into higher margin Ready-to-Eat (RTE) category
Out of Home: Starbucks – TATA Starbucks Private Limited is a 50:50 joint venture company, owned by Tata Consumer Products and Starbucks Corporation that owns and operates Starbucks outlets in India. The outlets are branded Starbucks “A Tata Alliance”.
Geographical Revenue
 Segment Revenue

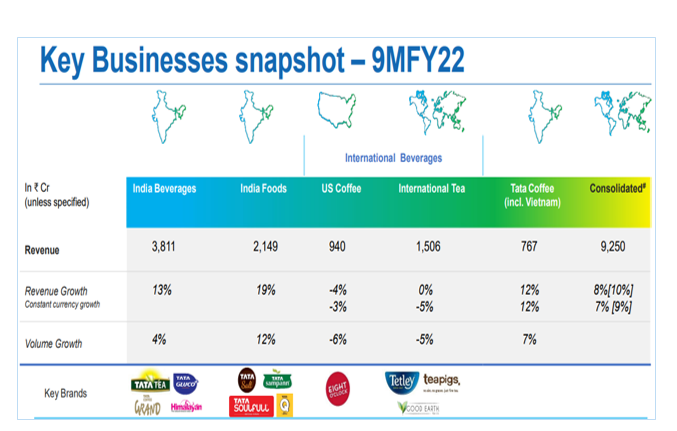
Highlights:
- India Beverages revenue includes India Packaged Beverages + NourishCo (subsidiary effective May’2020), but volume doesn’t include Nourishco volumes
- India Foods revenue includes Tata Soulfull (subsidiary effective Feb’21) and Tata Q (subsidiary effective Nov’21).
- India Food Business Registered strong volume growth of 12% during 9MFY22 led growth in Tata Sampann and Tata Salt Brand
- The Company is focusing on growth in Indian market with new launches across foods & beverage portfolio.
Quarterly Performance:
| Particulars (in Rs. Cr.) | 202112 | 202109 | 202012 | QoQ | YoY |
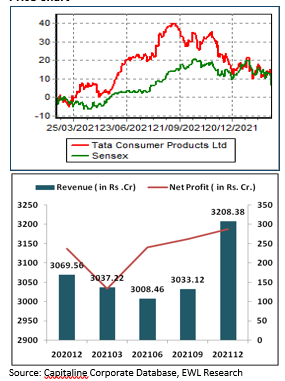
| Revenue from Operations | 3208.38 | 3033.12 | 3069.56 | 5.8% | 4.5% |
| Other Income | 25.04 | 39.62 | 19.49 | -36.8% | 28.5% |
| Total Income | 3233.42 | 3072.74 | 3089.05 | 5.2% | 4.7% |
| Total Expenditure | 2759.9 | 2636.13 | 2714.36 | 4.7% | 1.7% |
| Raw Material Consumed | 1161.58 | 1232.02 | 1392.56 | -5.7% | -16.6% |
| Stock Adjustment | 93.36 | 19.12 | -11.4 | – | – |
| Purchase of Finished Goods | 551.64 | 485.15 | 528.4 | 13.7% | 4.4% |
| Employee Expenses | 258.91 | 255.64 | 241.23 | 1.3% | 7.3% |
| Selling & Administrative Expenses | 245.34 | 211.88 | 209.71 | 15.8% | 17.0% |
| Other Expenses | 435.89 | 416.01 | 347.73 | 4.8% | 25.4% |
| EBITDA | 461.66 | 413.3 | 361.33 | 11.7% | 27.8% |
| Finance Cost | 16.16 | 19.78 | 18.09 | -18.3% | -10.7% |
| Depreciation | 69.8 | 69.31 | 64.4 | 0.7% | 8.4% |
| PBT | 400.74 | 363.83 | 298.33 | 10.1% | 34.3% |
| Exceptional Item | 13.18 | 16.31 | 6.13 | -19.2% | 115.0% |
| PBT | 387.56 | 347.52 | 292.2 | 11.5% | 32.6% |
| Tax | 99.88 | 86.13 | 55.17 | 16.0% | 81.0% |
| Profit After Tax | 287.68 | 261.39 | 237.03 | 10.1% | 21.4% |
| EBITDA Margin | 14.4% | 13.6% | 11.8% | 76 bps | 26 bps |
| PAT Margin | 9.0% | 8.6% | 7.7% | 35 bps | 12 bps |
Key Takeaways from Q3FY22 results and conference call
-
The company’s two-year revenue CAGR was 13.4%. India Beverage segment and India Foods segment reported volume growth of 6% and 4%, respectively.
-
With tapering of tea inflation, the profitability in India Tea business has improved.
-
The company has acquired Tata SmartFoodz Ltd (TSFL) which owns the brand Tata Q. It will result in premiumizing the product portfolio. The company will be able to capitalize on its reach in Modern trade and E-commerce.
-
The company has relaunched Tata Tea Agni during the quarter. It has also introduced Tata Tea Agni Adrak chai, new variant. Tata Tea Gold Care now accounts for 5.2% of sales of Tata Tea Gold.
-
The company has introduced a premium variant of Salt as Tata Salt SuperLite. As it is taking price hikes to pass on increase in costs, it has vacated some price points and has introduced Shuddh by Tata Salt at lower price points.
-
The company has also introduced dryfruits in 100% pure premium range under Sampann brand. Its earlier launch of Sampann Poha has been a success.
-
Tata Salt margins were impacted by higher input costs, higher power & fuel costs as well as freight costs.
-
TCPL has also introduced Tata Nature Alive mass premium natural mineral water during the quarter. Nourishco reported revenue growth of 91% (Two-year CAGR: 53%). Himalayan water turned EBIT positive during the quarter.
-
While third covid wave has resulted in short term challenges for Tata Starbucks and Nourishco, the company is optimistic about a quick normalization. The company is working towards structural simplification of its International business.
Industry Outlook
India Tea
The branded Indian tea market is estimated to be Rs 26,000 Crores, with unbranded constituting 30-35% of the overall market (by value). The branded market grew by 8% during the year FY21 despite a decline in the initial months due to the impact of lockdowns, led by tea price inflation. Tea is the favourite Indian beverage, and continues to see growth across all tiers through upgradation from loose to economy branded tea and movement ups the chain to Premium and Super Premium Teas.
Tata Consumer strengthened its leadership position in the Tea market by improving its volume market share (MAT) to 20.4% (0.6% pts improvement from last year) and value market (MAT) share to 21% (1% pts improvement compared to last year) in FY21.
India Food
The Indian staples industry is largely unorganised with share of branded players at less than 10%. The overall health, hygiene and wellness concerns are expected to give a fillip to the shift from loose and unorganised to branded consumption of food.
During FY21, Tata Salt strengthened its marke leadership position with value share increasing to 33% (Nielsen) in the packaged salt category. Tata Salt strengthened its market leadership position with value share increasing to 33% (Nielsen) in the packaged salt category in FY21
India Ready-To-Eat Food Market:
The Indian ready-to-eat food market stood at $261 million in 2017 and is projected to grow at a CAGR of over 16% during 2018-2023 to reach $647 million by 2023. Anticipated growth in the market can be attributed to rising urbanization, increasing disposable income of middle-class population and changing taste preferences of Indian consumers
India Bottled Water Market
India bottled water market was valued over USD 2434 million in FY2021 and is expected to grow at an impressive CAGR of 13.25%. 80% of which is unorganised — could see a de-growth over a period of time. Key brands include Bisleri, Bailley, Kinley, Aquafina, Himalayan, Oxyrich, Rail Neer and Vedica, to name a few. Bisleri has the largest market share and is bottled across over 120 plants in India, followed by Kinley, Aquafina and Bailley.
Tata Global Consumer is strengthening its packaged drinking water portfolio. It recently introduced Tata Nature Alive mass premium natural mineral water during the third quarter with Himalayan Natural Mineral Water and Tata Copper Plus Water was already in portfolio.
Balance Sheet
| Particulars (in Rs Cr.) | H1FY22 | FY21 | FY20 |
| Equity & Liabilities | |||
| Shareholders Fund | 14592.75 | 14534.51 | 13814.86 |
| – Share Capital | 92.16 | 92.16 | 92.16 |
| – Reserves & Surplus | 14500.59 | 14442.35 | 13722.7 |
| – Minority Interest | 1102.79 | 1092.53 | 1092.47 |
| Total Non Current Liabilities | 1585.17 | 1534.37 | 1616.67 |
| – Long Term Borrowings | 632.01 | 676.64 | 1086.63 |
| – Deferred Tax Liabilities(Net) | 658.75 | 570.16 | 316.03 |
| – Other Long Term Liabilities | 97 | 95.11 | 30.79 |
| – Long Term Provisions | 197.41 | 192.46 | 183.22 |
| Total Current Liabilities | 2510.78 | 3094.46 | 1978.6 |
| – Short Term Borrowings | 536.16 | 957.43 | 425.78 |
| – Trade Payables | 1505.41 | 1625.47 | 943.99 |
| – Other Current Liabilities | 371.6 | 409.85 | 516.42 |
| – Short Term Provisions | 97.61 | 101.71 | 92.41 |
| Total Equity & Liabilities | 19791.49 | 20255.87 | 18502.6 |
| Assets | |||
| Total Non Current Assets | 13326.11 | 13207.24 | 12820.54 |
| – Fixed Assets | 4507.61 | 4539.41 | 4417.56 |
| -Tangible Assets | 1656.06 | 1642.25 | 1551 |
| – Intangible Assets | 10374.84 | 10380.88 | 10105.04 |
| – Intangible Assets under Development/R&D | 10.98 | 19.68 | 7.79 |
| – Capital Work in Progress | 66.95 | 93.17 | 87.56 |
| – Goodwill on Consolidation | 7601.22 | 7596.57 | 7333.83 |
| – Non Current Investments | 676.92 | 482.73 | 489.3 |
| – Deferred Tax Asset(Net) | 37.28 | 38.05 | 29.56 |
| – Long Term Loans & Advances | 88.79 | 96.79 | 54.67 |
| – Other Non Current Assets | 414.29 | 453.69 | 495.62 |
| Total Current Assets | 6465.38 | 7048.63 | 5682.06 |
| – Current Investments | 175.38 | 323.16 | 833.55 |
| – Inventories | 2281.93 | 2249.16 | 1712.03 |
| – Trade Receivables | 651.99 | 761.32 | 922.41 |
| – Cash & Cash Equivalents | 2564.11 | 3074.88 | 1621.46 |
| – Short Term Loans & Advances | 222.12 | 185.12 | 116.54 |
| – Other Current Assets | 569.85 | 454.99 | 476.07 |
| Total Assets | 19791.49 | 20255.87 | 18502.6 |
Cash Flow Statement
| Particulars (in Rs, Cr. ) | H1FY22 | FY21 | FY20 | FY19 |
| Cash and Cash Equivalents at Beginning of the year | 1773.18 | 889.34 | 737.48 | 698.17 |
| Net Cash from Operating Activities | 542.82 | 1656.37 | 1082.23 | 209.87 |
| Net Cash Used in Investing Activities | -466.46 | -408.41 | -672.77 | 73.28 |
| Net Cash Used in Financing Activities | -910.46 | -426.03 | -308.33 | -223.73 |
| Net Inc/(Dec) in Cash and Cash Equivalent | -834.1 | 821.93 | 101.13 | 59.42 |
| Cash and Cash Equivalents at End of the year | 945.97 | 1773.18 | 889.34 | 737.48 |
Key Financial Ratios
| Key Ratios | H1FY22 | FY21 | FY20 | FY19 | FY18 |
| Debt Equity Ratio | 0.08 | 0.11 | 0.11 | 0.15 | 0.15 |
| Current Ratio | 3.27 | 3.3 | 3.66 | 4 | 3.79 |
| EBITDA Margin | 13.45% | 13.31% | 13.41% | 10.84% | 12.31% |
| Interest Coverage Ratio | 16.83 | 20.09 | 14.6 | 15 | 18.61 |
| RONW | 4.97 | 5.89 | 4.64 | 5.57 | 7.05 |
| ROCE | 7.87 | 8.48 | 7.57 | 9.29 | 9.81 |
| Debtors Days | 19.59 | 23.95 | 34.93 | 34.26 | 34.72 |
| Creditors Days | 66.15 | 75.36 | 54.73 | 50.41 | 56.98 |
Extracts:
-
Tata Consumer has strong liquidity with Cash & Cash Equivalents stood at Rs. 2564 Crore and have low Debt to Equity ratio of 0.08 at the end of December, 2021
-
Debtor Days improved from 24 days in FY21 to 19 days in H1FY22
-
Company has strong track record of Positive Operating Cash flow
-
Company has low ROCE and RONW which is expected to improved with increase in Profitability from new product mix.
Disclosure in pursuance of Section 19 of SEBI (RA) Regulation 2014
Elite Wealth Limited does/does not do business with companies covered in its research reports. Investors should be aware that the Elite Wealth Limited may/may not have a conflict of interest that could affect the objectivity of this report. Investors should consider this report as only information in making their investment decision and must exercise their own judgment before making any investment decision.
For analyst certification and other important disclosures, see the Disclosure Appendix, or go to www.elitewealth.in. Analysts employed by Elite Wealth Limited are registered/qualified as research analysts with SEBI in India.( SEBI Registration No.: INH100002300)
Disclosure Appendix
Analyst Certification (For Reports)
Israil Khan, Elite Wealth Limited, suhail@elitewealth.in
The analyst(s) certify that all of the views expressed in this report accurately reflect my/our personal views about the subject company or companies and its or their securities. I/We also certify that no part of my compensation was, is or will be, directly or indirectly, related to the specific recommendations or views expressed in this report. Unless otherwise stated, the individuals listed on the cover page of this report are analysts in Elite Wealth Limited.
As to each individual report referenced herein, the primary research analyst(s) named within the report individually certify, with respect to each security or issuer that the analyst covered in the report, that:
(1) all of the views expressed in the report accurately reflect his or her personal views about any and all of the subject securities or issuers; and
(2) no part of any of the research analyst’s compensation was, is, or will be directly or indirectly related to the specific recommendations or views expressed in the report.
For individual analyst certifications, please refer to the disclosure section at the end of the attached individual notes.
Research Excerpts
This note may include excerpts from previously published research. For access to the full reports, including analyst certification and important disclosures, investment thesis, valuation methodology, and risks to rating and price targets, please visit www.elitewealth.in.
Company-Specific Disclosures
Important disclosures, including price charts, are available and all Elite Wealth Limited covered companies by visiting https://www.elitewealth.in, or emailing research@elitestock.com with your request. Elite Wealth Limited may screen companies based on Strategy, Technical, and Quantitative Research. For important disclosures for these companies, please e-mail research@elitestock.com.
Options related research:
If the information contained herein regards options related research, such information is available only to persons who have received the proper option risk disclosure documents. For a copy of the risk disclosure documents, please contact your Broker’s Representative or visit the OCC’s website at https://www.elitewealth.in
Other Disclosures
All research reports made available to clients are simultaneously available on our client websites. Not all research content is redistributed, e-mailed or made available to third-party aggregators. For all research reports available on a particular stock, please contact your respective broker’s sales person.
Ownership and material conflicts of interest Disclosure
Elite Wealth Limited policy prohibits its analysts, professionals reporting to analysts from owning securities of any company in the analyst’s area of coverage. Analyst compensation: Analysts are salary based permanent employees of Elite Wealth Limited. Analyst as officer or director: Elite Wealth Limited policy prohibits its analysts, persons reporting to analysts from serving as an officer, director, board member or employee of any company in the analyst’s area of coverage.
Country Specific Disclosures
India – For private circulation only, not for sale.
Legal Entities Disclosures
Mr. Ravinder Parkash Seth is the Managing Director of Elite Wealth Ltd (EWL, henceforth), having its registered office at Casa Picasso, Golf Course Extension, Near Rajesh Pilot Chowk, Radha Swami, Sector-61, Gurgaon-122001 Haryana, is a SEBI registered Research Analyst and is regulated by Securities and Exchange Board of India. Telephone:011-43035555, Facsimile: 011-22795783 and Website: www.elitewealth.in
EWL discloses all material information about itself including its business activity, disciplinary history, the terms and conditions on which it offers research report, details of associates and such other information as is necessary to take an investment decision, including the following:
1. Reports
a) EWL or his associate or his relative has no financial interest in the subject company and the nature of such financial interest;
(b) EWL or its associates or relatives, have no actual/beneficial ownership of one per cent. or more in the securities of the subject company, at the end of the month immediately preceding the date of publication of the research report or date of the public appearance;
(c) EWL or its associate or his relative, has no other material conflict of interest at the time of publication of the research report or at the time of public appearance;
2. Compensation
(a) EWL or its associates have not received any compensation from the subject company in the past twelve months;
(b) EWL or its associates have not managed or co-managed public offering of securities for the subject company in the past twelve months;
(c) EWL or its associates have not received any compensation for investment banking or merchant banking or brokerage services from the subject company in the past twelve months;
(d) EWL or its associates have not received any compensation for products or services other than investment banking or merchant banking or brokerage services from the subject company in the past twelve months;
(e) EWL or its associates have not received any compensation or other benefits from the Subject Company or third party in connection with the research report.
3 In respect of Public Appearances
(a) EWL or its associates have not received any compensation from the subject company in the past twelve months;
(b) The subject company is not now or never a client during twelve months preceding the date of distribution of the research report and the types of services provided by EWL


