
| Recommendation | CMP | Target Price | Time Horizon |
| Buy | Rs. 943 | Rs. 1115 | 12 Months |
Tata Chemical is one of the oldest company from Tata Group, they are the third largest soda Ash and sixth largest sodium bicarbonate producer in the world, Company has divested all its non-core business and are now scaling up the core basic and specialty chemicals business. The company operates in four divisions namely Nutritional Science, Energy Science, Agro Science and Material Science
Stock Details |
|
| Market Cap. (Cr.) | 22936.04 |
| Face Value | 10.00 |
| Equity (Cr.) | 254.82 |
| 52 Wk. high/low | 1158/404.50 |
| BSE Code | 500770 |
| NSE Code | TATACHEM |
| Book Value (Rs) | 562.30 |
| Industry | Chemicals |
| P/E | 37.10 |
Share Holding Pattern % |
|
Promoter |
37.98 |
| FIIs | 14.45 |
| Institutions | 20.02 |
| Non Promoter Corp. | 4.66 |
| Public & Others
Government |
22.86
0.03 |
| Total | 100.00 |
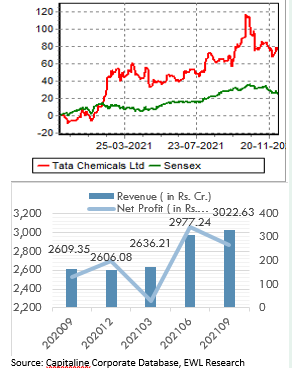
Price Chart
Key Investment Rationale:
-
Soda ash is a key raw material in the process of lithium – ion batteries, as the world is planning to shift from conventional vehicle to EV demand for soda ash is going to gain pace.
-
China being the largest exporter of chemical to the world is discouraging chemical factory because of environmental issue which is opening huge opportunity for Tata Chemical and in second quarter they have also started exporting to china.
-
Company has set up recycling plant of lithium ion batteries and has plan to increase it to 120 tonnes per annum in which they extract metal salts of lithium,cobalt,nickle and manganese, these salts are used in paints, ceramic pigments industry.
-
There has been constant increase in soda ash prices as company has taken price hike of ₹ 3000/tonne over April- September and in October taken price hike of ₹4000/ tonne in October 21.
-
Company has expansion of ₹ 2700 crore in Mithapur plant which is expected to come on stream by FY24, this is going to drive incremental revenue for the company.
- In 2QFY22 company reported solid number where Revenue increase by 16% YoY EBITDA margin came in at ₹ 501 crore and PAT was up 87% YOY at ₹ 248 crore. Soda Ash business saw volume growth of 27%.
-
From 1st Jan 2021 US government has reduce royalty on soda ash and sodium bicarbonate from 6% to 2% for 10years, which will improve margin of Tata chemical as 35% of their total revenue come from US.
-
Tata Chemical has solid balance sheet, it hold 50% stake in rallis India they have refinanced their debt which will reduce their interest payment by roughly 50 crore a year.
Outlook:
Tata Chemical one of the largest producer of soda ash, basic chemicals and specialty chemicals in India they also produce agro chemical and sell it through rallis India. In second quarter despite cost pressure company was able to protect its margin due to rise in volume and price increase, company is expanding its capacity from internal cash flow. Chemical Industry is expected to do very well because of china plus one policy and pick up in electric vehicles .On performance front we expect company to report EPS of Rs.43.7 for FY23E, at CMP of ₹943 PE works out to be 21.57x. Hence, investors can buy the stock at CMP of Rs.943 for target price of Rs.1115. Time frame should be 9-12months.
Source: Livemint, EWL Research
Key Products:
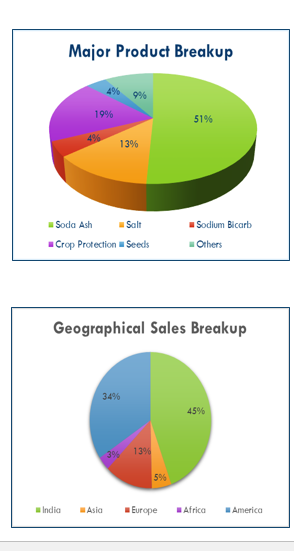
Soda Ash – Tata Chemical produces light soda ash using the ammonia soda process, company is the largest and most diversified soda ash company. They have manufacturing capacity in India, US, UK and Kenya that can supply soda ash across the globe, and have roughly 5.5 million tonne capacity.
Use of Soda Ash–
1. In manufacturing glass as it reduces melting temperature of the sand use in glass formation which help in shaping glass articles such as tableware and float glass.
2. In detergent and soap to give smoother surface.
3. Production of chemicals like sodium bicarbonate, sodium silicate and sodium chromate.
4. In water treatment plant, effluent treatment, paper and pulp industry and drugs industry.
5. Soda Ash is use in the process of lithium batteries.
Sodium Bicarbonate: Tata Chemical is the sixth largest sodium Bicarbonate producer in the world, they are adding new value-added products through application development and formulations expanding current product with new ingredients so that they can generate better `a net zero carbon Sodium Bicarbonate manufacturer.
Use of Sodium Bicarbonate-
-
25 percent of the total amount of sodium bicarbonate utilized worldwide is used as an animal feed additive.
-
Sodium Bicarbonate is use as a purifier in complex plastic and polymer.
-
If we break sodium Bicarbonate then O2 is released which is use in rubber and plastic industry for shaping products.
-
It destroy bacteria and fungi so use in pharma industry.
Salt: Salt is the oldest and core of the company, in February they have commissioned 200 crore plant and bought the annual capacity to 800000 tonnes in their Mithapur plant. In packaged iodized salt they have market share of 17.3%. Tata Chemical also produces industrial salt under the brand “MAGADI” Industrial salt, this is used in large number of industry.
Use of Industrial Salt:
- Production of soap and Batteries.
- Animal Feed Industry
- Bleaching wood pulp for paper production.
- Leather tanning
- Caustic and chlorine production.
Crop Protection and Seeds: Tata Chemicals sells its agri protection products through its subsidiary Rallis India, they cover wide range of products like fungicides insecticides, and herbicides. Through its Lithium- ion battery recycle plant it produces Manganese sulfate which increases leaf nutrient also use for base manure, soak seed, and in the sprinkling on blade face to increase crop production yield. Due to the indiscriminate use of irrigation water and fertilisers, a large part of India’s agricultural land has become degraded. The use of micro irrigation techniques and fertigation is the only way to manage these resources efficiently. Rallis has a range of specialist solutions which provide micro nutrients and growth inputs for a healthy crop.
| Investments : | |||
| Quoted Shares | |||
| Company | No of shares | Price* | Amount(in Crore) |
| The Indian Hotels | 10689348 | 193 | 206.30 |
| Orient Hotels Limited | 2523000 | 39.2 | 9.89 |
| Tata Investment Corporation Ltd | 441015 | 1455.5 | 64.19 |
| Tata Steel | 3090051 | 1140 | 352.27 |
| Tata motors Ltd | 1966294 | 477 | 93.79 |
| Titan company Limited | 13826180 | 2350 | 3249.15 |
| Total Quoted Investment | 3975.59 | ||
| Unquoted Investment | 516.13 | ||
| TOTAL INVESTMENT | 4491.72 | ||
| *Price as on 7-12-2021 | |||
Indian Chemical Industry :
India and china has a very dominate position in the world chemical Industry. India has a large pool of scientists with a potential to steer the industry ahead to greater heights. Indian manufacturers have increased at a CAGR of 11% in revenue between FY15 and FY21, India’s share has increase in the global specialty chemicals market to 4% from 3%, according to the Crisil report.
Supply disruption in China and Europe are creating new opportunity for Indian chemical Industry, after covid global companies are also looking for new supplier which are outside China that has caused the global end-user industries to diversify their vendor base mainly towards Indian players. Closure of plants in the EU and China due to increasing environmental concerns have favoured Indian manufacturers to invest further in specialty chemicals.
The market size of Chemicals sector of India is around $178 billion; expected to grow to $300 Billion by FY2025.
In the chemical sector, Government has allowed 100% FDI and industrial licensing with exception to few hazardous chemicals. Government has also launched PLI scheme to attract new Investment in Chemical Industry Total FDI inflow in the chemicals sector reached around US$ 18.06 billion between April 2000 and September 2020.
Tata Chemical is the 3rd-largest Soda Ash player in the world. The Company has two business segments Basic Chemistry Products and Specialty Products catering to varied customer segments all around the world. Basic Chemistry Products mainly consist of sodium bicarbonate, soda ash, salt, etc. Company has divested all its non-core business and are now scaling up the core basic and specialty chemicals business. The operations in Basic Chemical segment are spread across India, the United States of America, United Kingdom and Kenya. It caters to customers in Glass, Detergent, Food and Pharma industry. Specialty products consists of specialty food ingredients such as Prebiotics, Formulations for Feed, Food and Pharma customers, Specialty Silica for Rubber/Tyre industry and Crop Care and Seeds for the Farm sector through its subsidiary, Rallis India Limited.
Source: globe newswire, Annual Report
Q3FY21 Financial Performance – Consolidated
| Particulars | Q2FY22 | Q1FY22 | Q2FY21 | YoY% | QoQ% |
| Net Sales | 3022.63 | 2977.24 | 2609.35 | 15.84 | 1.52 |
| Other Income | 134.21 | 105.02 | 78.97 | 69.95 | 27.79 |
| Total Income | 3156.84 | 3082.26 | 2688.32 | 17.43 | 2.42 |
| Total Expenditure | 2532.78 | 2376.01 | 2223.1 | 13.93 | 6.60 |
| PBIDT | 624.06 | 706.25 | 465.22 | 34.14 | -11.64 |
| Interest | 83.81 | 81.21 | 83.63 | 0.22 | 3.20 |
| PBDT | 540.25 | 625.04 | 381.59 | 41.58 | -13.57 |
| Depreciation | 199.94 | 197.45 | 192.43 | 3.9 | 1.26 |
| PBT | 340.31 | 427.59 | 189.16 | 79.91 | -20.41 |
| Tax | 62.29 | 86.47 | 79.67 | -21.81 | -27.96 |
| Deferred Tax | 10 | -1.21 | -22.6 | -144.25 | -926.45 |
| Reported Profit After Tax | 268.02 | 342.33 | 132.09 | 102.91 | -21.71 |
| EPS | 34.72 | 45.2 | 11.06 | 213.92 | -23.19 |
| Q2FY22 | Q1FY22 | Q2FY21 | YoY(Bps) | QoQ(Bps) | |
| PBIDTM (%) | 20.65 | 23.72 | 17.83 | 282 | -307 |
| PBDTM (%) | 17.87 | 20.99 | 14.62 | 325 | -312 |
| PATM (%) | 7.32 | 9.67 | 2.7 | 462 | -235 |
Balance Sheet:
| Particulars | 2021 | 2020 | 2019 |
| SOURCES OF FUNDS : | |||
| Share Capital | 254.82 | 254.82 | 254.82 |
| Reserves Total | 14035.15 | 12642.84 | 12086.45 |
| Total Shareholders Funds | 14289.97 | 12897.66 | 12341.27 |
| Minority Interest | 852.6 | 763.77 | 2914.67 |
| Secured Loans | 3507.17 | 3261.96 | 2972.89 |
| Unsecured Loans | 3425.36 | 4440.41 | 3156.96 |
| Total Debt | 6932.53 | 7702.37 | 6129.85 |
| Other Liabilities | 1771.08 | 1903.12 | 1633.83 |
| Total Liabilities | 23846.18 | 23266.92 | 23019.62 |
| APPLICATION OF FUNDS : | |||
| Net Block | 15261.03 | 15355.61 | 13550.99 |
| Capital Work in Progress | 1093.51 | 835.02 | 773.83 |
| Investments | 5815.82 | 4284.8 | 5615.27 |
| Current Assets, Loans & Advances | |||
| Inventories | 1686.56 | 1869.16 | 1725.58 |
| Sundry Debtors | 1396.99 | 1579.92 | 1452.5 |
| Cash and Bank | 1411.01 | 2079.52 | 1952.19 |
| Loans and Advances | 587.66 | 669.25 | 715.7 |
| Total Current Assets | 5082.22 | 6197.85 | 5845.97 |
| Less : Current Liabilities and Provisions | |||
| Current Liabilities | 2398.85 | 2511.05 | 2171.61 |
| Provisions | 520.06 | 472.84 | 416.51 |
| Total Current Liabilities | 2918.91 | 2983.89 | 2588.12 |
| Net Current Assets | 2163.31 | 3213.96 | 3257.85 |
| Net Deferred Tax | -1572.11 | -1422.63 | -1260.94 |
| Other Assets | 1084.62 | 1000.16 | 1082.62 |
| Total Assets | 23846.18 | 23266.92 | 23019.62 |
| Contingent Liabilities | 1141.05 | 1056.87 | 1023.23 |
Cash Flow Statement:
| Particulars (₹ in Crores) | 2021 | 2020 | 2019 |
| Cash Flow Summary | |||
| Cash and Cash Equivalents at Beginning of the year | 1254.26 | 1888.38 | 3945.93 |
| Net Cash from Operating Activities | 2037.3 | 1780.09 | 1581.29 |
| Net Cash Used in Investing Activities | -1146.57 | -2284.95 | -1927.01 |
| Net Cash Used in Financing Activities | -1455.65 | -129.26 | -1711.83 |
| Net Inc/(Dec) in Cash and Cash Equivalent | -564.92 | -634.12 | -2057.55 |
| Cash and Cash Equivalents at End of the year | 689.34 | 1254.26 | 1888.38 |
Key Financial Ratios:
| 2021 | 2020 | 2019 | |||||
| Key Ratios | |||||||
| Debt-Equity Ratio | 0.54 | 0.55 | 0.52 | ||||
| Long Term Debt-Equity Ratio | 0.33 | 0.34 | 0.44 | ||||
| Current Ratio | 0.78 | 0.89 | 1.48 | ||||
| Turnover Ratios | |||||||
| Fixed Assets | 0.57 | 0.63 | 0.7 | ||||
| Inventory | 5.95 | 5.9 | 6.6 | ||||
| Debtors | 7.1 | 6.99 | 7.63 | ||||
| Total Asset Turnover Ratio | 0.45 | 0.46 | 0.47 | ||||
| Interest Cover Ratio | 2.73 | 22.69 | 5.02 | ||||
| PBIDTM (%) | 16.66 | 79.47 | 22.27 | ||||
| PBITM (%) | 9.47 | 73.19 | 16.87 | ||||
| PBDTM (%) | 13.18 | 76.25 | 18.91 | ||||
| CPM (%) | 11.31 | 74.18 | 16.72 | ||||
| APATM (%) | 4.13 | 67.89 | 11.32 | ||||
| ROCE (%) | 4.4 | 36.42 | 9.08 | ||||
| RONW (%) | 3.21 | 57.03 | 10.17 | ||||
| Payout (%) | 64.24 | 92.98 | 48.72 | ||||
|
7.1 | 6.99 | 7.63 | ||||
|
5.95 | 5.9 | 6.6 |
Extract of Q2FY22 Earning:
-
Tata Chemical total revenue from operations rose 16% YoY to ₹3,023 crore in September Quarter. The consolidated operating profit increased 30% YoY to ₹ 501 crore during the December quarter. This improvement in company performance is because of better reliasation and volume growth.
-
During second quarter company reported strong profit growth of 87% YoY, Profit came in at ₹248 crore
-
Company saw robust volume growth in soda ash segment of 27%, in salt segment it was 5%, soda ash pricing has also improved in second quarter.
-
In FY2021, overall cash flow generation was ₹ 203.73 crore and free cash flow was ₹79.54 crore.
-
In second quarter despite the headwind company is able to maintain their margin as coal and freight prices has gone up 4x, gas prices has also gone up substantially.
-
EBITDA Margin of the company improved to 23% in Q2FY22 from 16% in Q2FY21.
-
Gross Debt as on 30th Sept 21 is ₹ 7,108 Cr vs ₹ 6,933 Cr as on Mar21.This increase in debt is due to capacity expansion.
Disclosure in pursuance of Section 19 of SEBI (RA) Regulation 2014
Elite Wealth Limited does/does not do business with companies covered in its research reports. Investors should be aware that the Elite Wealth Limited may/may not have a conflict of interest that could affect the objectivity of this report. Investors should consider this report as only information in making their investment decision and must exercise their own judgment before making any investment decision.
For analyst certification and other important disclosures, see the Disclosure Appendix, or go to www.elitewealth.in. Analysts employed by Elite Wealth Limited are registered/qualified as research analysts with SEBI in India.( SEBI Registration No.: INH100002300)
Disclosure Appendix
Analyst Certification (For Reports)
Israil Khan, Elite Wealth Limited, suhail@elitewealth.in
The analyst(s) certify that all of the views expressed in this report accurately reflect my/our personal views about the subject company or companies and its or their securities. I/We also certify that no part of my compensation was, is or will be, directly or indirectly, related to the specific recommendations or views expressed in this report. Unless otherwise stated, the individuals listed on the cover page of this report are analysts in Elite Wealth Limited.
As to each individual report referenced herein, the primary research analyst(s) named within the report individually certify, with respect to each security or issuer that the analyst covered in the report, that:
(1) all of the views expressed in the report accurately reflect his or her personal views about any and all of the subject securities or issuers; and
(2) no part of any of the research analyst’s compensation was, is, or will be directly or indirectly related to the specific recommendations or views expressed in the report.
For individual analyst certifications, please refer to the disclosure section at the end of the attached individual notes.
Research Excerpts
This note may include excerpts from previously published research. For access to the full reports, including analyst certification and important disclosures, investment thesis, valuation methodology, and risks to rating and price targets, please visit www.elitewealth.in.
Company-Specific Disclosures
Important disclosures, including price charts, are available and all Elite Wealth Limited covered companies by visiting https://www.elitewealth.in, or emailing research@elitestock.com with your request. Elite Wealth Limited may screen companies based on Strategy, Technical, and Quantitative Research. For important disclosures for these companies, please e-mail research@elitestock.com.
Options related research:
If the information contained herein regards options related research, such information is available only to persons who have received the proper option risk disclosure documents. For a copy of the risk disclosure documents, please contact your Broker’s Representative or visit the OCC’s website at https://www.elitewealth.in
Other Disclosures
All research reports made available to clients are simultaneously available on our client websites. Not all research content is redistributed, e-mailed or made available to third-party aggregators. For all research reports available on a particular stock, please contact your respective broker’s sales person.
Ownership and material conflicts of interest Disclosure
Elite Wealth Limited policy prohibits its analysts, professionals reporting to analysts from owning securities of any company in the analyst’s area of coverage. Analyst compensation: Analysts are salary based permanent employees of Elite Wealth Limited. Analyst as officer or director: Elite Wealth Limited policy prohibits its analysts, persons reporting to analysts from serving as an officer, director, board member or employee of any company in the analyst’s area of coverage.
Country Specific Disclosures
India – For private circulation only, not for sale.
Legal Entities Disclosures
Mr. Ravinder Parkash Seth is the Managing Director of Elite Wealth Ltd (EWL, henceforth), having its registered office at Casa Picasso, Golf Course Extension, Near Rajesh Pilot Chowk, Radha Swami, Sector-61, Gurgaon-122001 Haryana, is a SEBI registered Research Analyst and is regulated by Securities and Exchange Board of India. Telephone:011-43035555, Facsimile: 011-22795783 and Website: www.elitewealth.in
EWL discloses all material information about itself including its business activity, disciplinary history, the terms and conditions on which it offers research report, details of associates and such other information as is necessary to take an investment decision, including the following:
1. Reports
a) EWL or his associate or his relative has no financial interest in the subject company and the nature of such financial interest;
(b) EWL or its associates or relatives, have no actual/beneficial ownership of one per cent. or more in the securities of the subject company, at the end of the month immediately preceding the date of publication of the research report or date of the public appearance;
(c) EWL or its associate or his relative, has no other material conflict of interest at the time of publication of the research report or at the time of public appearance;
2. Compensation
(a) EWL or its associates have not received any compensation from the subject company in the past twelve months;
(b) EWL or its associates have not managed or co-managed public offering of securities for the subject company in the past twelve months;
(c) EWL or its associates have not received any compensation for investment banking or merchant banking or brokerage services from the subject company in the past twelve months;
(d) EWL or its associates have not received any compensation for products or services other than investment banking or merchant banking or brokerage services from the subject company in the past twelve months;
(e) EWL or its associates have not received any compensation or other benefits from the Subject Company or third party in connection with the research report.
3 In respect of Public Appearances
(a) EWL or its associates have not received any compensation from the subject company in the past twelve months;
(b) The subject company is not now or never a client during twelve months preceding the date of distribution of the research report and the types of services provided by EWL


