
State Bank of India (SBI), a Fortune 500 company, is a leading Indian multinational public sector banking and financial services institution headquartered in Mumbai. With a legacy spanning over 200 years, SBI is the most trusted bank in India, serving over 500 million customers. The bank boasts an asset base of over ₹61 trillion and operates through a vast network of 22,500 branches, 63,580 ATMs, and 82,900 BC outlets. SBI’s diversified portfolio includes subsidiaries such as SBI General Insurance, SBI Life Insurance, SBI Mutual Fund, and SBI Card. With a global presence across 241 offices in 29 countries, SBI continues to innovate and deliver sustainable, customer-centric banking solutions, upholding its core values of service, transparency, ethics, and sustainability.
| Recommendation | Target Price | Time Horizon |
| BUY | Rs. 950.00 | 9-12 Months |
Stock Details |
|
| Market Cap. (Cr.) | 6,66,312 |
| Equity (Cr.) | 892.46 |
| Face Value | 1 |
| 52 Wk. high/low | 912/680 |
| BSE Code | 500112 |
| NSE Code | SBIN |
| Book Value (Rs) | 519 |
| Industry | Banks – Public Sector |
| P/E | 8.39 |
Share Holding Pattern % |
|
Promoter |
57.43 |
| FIIs | 10.27 |
| Institutions | 24.79 |
| Public | 7.35 |
| Government | 0.14 |
| Total | 100 |
Key Investment Rationale:
•Digital Banking & Technological Advancements: SBI has made significant strides in digital banking, with over 8.5 crore customers registered on its YONO platform. In Q3FY25, 64% of regular savings bank accounts were opened through YONO, reflecting the bank’s strong push towards digitization. This growth in digital engagement aligns with SBI’s strategy to enhance customer experience and expand its digital offerings, positioning itself as a leading digital bank in India with growing adoption and usage of its platforms.
•Gen Z Focus and Digital Engagement: SBI is proactively engaging Gen Z customers, with 36% of its customer base under the age of 30. A key strategy is hyper-personalization through data analytics and digital products, ensuring that offerings cater to the younger demographic. The launch of marketing technology (MarTech) in mid-2025 will further enhance product gamification, aiming to strengthen relationships with this digital-native audience and expand customer engagement through tailored experiences.
•Continued Focus on Sustainable Value Creation: SBI remains focused on creating long-term value not only for the bank but also for the broader economy. Through strong liability franchises, refined processes, and consistent improvements in underwriting standards, the bank is committed to delivering value to all stakeholders. The emphasis on sustainable growth, especially in its core business areas, allows SBI to drive economic development, strengthen its position in India’s banking sector, and contribute to the overall growth of the nation’s financial ecosystem.
•Branch Expansion and Deposit Mobilization: Despite having the largest branch network, SBI continues to expand its presence with plans to open 400-430 new branches in the current year. The focus is on establishing branches in growing areas such as new urban conglomerates and emerging colonies, with careful planning for branch locations. The bank’s deposit mobilization remains robust, driven by its strong franchise, without engaging in rate wars. Branch network expansion supports customer outreach and strengthens the bank’s ability to service a growing customer base.
Product and Services of the bank
- Personal Banking: SBI offers loan products, Salary Packages, Digital Loans, NRI Business, and Wealth Management. It disbursed ₹1.97 lakh crore in home loans, ₹2.01 lakh crore in personal loans, and provided financial assistance to 1,26,717 students, serving 29.46 lakh home loan customers.
- Corporate Banking: SBI’s corporate credit portfolio stands at ₹11.38 lakh crore. In FY2024, it funded 48 large projects through its Project Finance and Structuring SBU, serving the entire corporate ecosystem.
- SME Banking: SBI’s SME portfolio exceeds ₹4 lakh crore with 20.53% growth in FY2024. The bank serves 20 lakh SME customers via 864 branches and 2,117 dedicated relationship managers.
- Government Banking: SBI recorded a turnover of ₹65.55 lakh crore and added 2.43 lakh new pension accounts. The bank holds a 63% market share in central government business and supports e-governance initiatives.
- International Banking: With 241 branches across 29 countries, SBI strengthens its global presence and offers comprehensive banking services internationally.
- Rural Banking: SBI’s agricultural lending exceeds ₹3 lakh crore, with 20,054 loans under government schemes. The bank holds a 29% market share in NRLM loans and operates 152 Rural Self-Employment Training Institutes.
Indian Economy Overview
India’s economy is projected to grow at 6.5% in FY2025, supported by strong domestic demand, strategic government investments, and growth across key sectors. The industrial sector has shown resilience, with manufacturing and mining activities contributing to an uptick in the Index of Industrial Production (IIP). The services sector, particularly trade, transport, and financial services, continues to play a vital role in driving economic expansion. Inflation has moderated significantly to 3.61% in Q3 FY2025, driven by a sharp fall in vegetable prices, which allows the Reserve Bank of India (RBI) to maintain stable interest rates.
Indian Banking Sector Performance
Net Interest Income (NII) of select Scheduled Commercial Banks (SCBs) grew at a slower pace of 8.7% in Q3FY25, reaching Rs. 1.28 lakh crore, compared to 9.25% in Q3FY24 and the Net Interest Margin (NIM) for SCBs reduced on a YoY basis by 7 bps and stood at 3.36%, This slowdown can be attributed to slow credit growth amidst stress in unsecured loan segments, increased risk weights and a reduction in the interest rate spread.
SCBs reported a rise of 10.3% YoY basis in advances for Q3FY25, compared to 11.8% in Q3FY24. PVBs advances increased by 8.7% YoY basis while PSBs grew comparatively higher at 12.7%. Meanwhile, deposits grew at 11.7% YoY basis in Q3FY25. CASA ratio continued to decline and reached 34.2% in Q3FY25. NII of PVBs grew 8.8% YoY basis however and PSBs increased by 8.3% in Q3FY25. The moderate growth was driven by loan mix and credit expansion, which was partially offset by an increased cost of funds.
The banking sector has continued to witness a reduction in NIMs in Q3FY25. In Q3FY25, deposit offtake has continued to outpace credit growth. Lenders continue to grapple with mobilizing low-cost CASA. Despite the slower growth of NII, the banking sector remains resilient. Additionally, regulatory changes and competitive constraints on interest rates have further pressured NIMs. NIMs are expected to remain under pressure in the 4th quarter Net Interest Margin Squeeze Continues Amidst Slow Credit Growth of the financial year. Further, margins will also be monitored as funding costs continue to remain elevated, and any potential rate cuts would likely dent lending rates, further impacting NIMs.
Management Commentary on the business & its future prospects:
- Credit and Deposit Growth: The bank targets 14-16% credit growth and 10% deposit growth, backed by a strong pipeline of sanctioned loans and proposals, anticipating substantial disbursals in the upcoming months to meet targets.
- Deposit Costs: Deposit costs rose by 7-8 bps, with a shift towards fixed deposits. While this pressures the CASA ratio, the bank is focusing on improving the ratio by encouraging salary accounts and enhancing deposit mix.
- Vision for Future Growth: SBI’s management remains committed to achieving long-term, sustainable growth by continuing to strengthen its leadership position across business segments. With a robust capital base, superior asset quality, and a focus on digitization and customer outreach, the bank is well-positioned to maintain its growth trajectory.
- Economic Impact: The bank anticipates a rise in credit demand, especially in sectors like SMEs and agriculture, driven by budget measures like tax cuts and savings incentives, potentially boosting retail loan growth and personal loan demand.
- AI and Digitalization: SBI is leveraging AI for customer personalization, risk management, and staff training, with initiatives like “Ask SBI” to enhance operational efficiency. The bank aims for broader AI adoption, positioning itself as a digital leader.
- International Operations: The bank’s international portfolio, valued at over ₹6 trillion, continues to show resilience. Its focus on trade finance, local credit, and ECBs ensures stable margins, despite global volatility, and supports steady cross-border performance.
Q3FY25 Result Analysis
- Interest Earned & NII: The bank earned INR 117,426.63 crore in interest in Q3 FY’25, reflecting a 10% growth from INR 106,733.78 crore in Q3 FY’24. On a QoQ basis, interest earned increased by 3.12% from INR 113,870.56 crore in Q2 FY’25. Net Interest Income (NII) rose 4.1% YoY from INR 39,816 crore, but declined slightly by 0.4% QoQ from INR 41,620 crore.
- Deposits & Advances: Total deposits grew 9.8% YoY to INR 5,229,384 crore from INR 4,762,221 crore in Q3 FY’24, and increased 2.19% QoQ from INR 5,117,285 crore in Q2 FY’25. Total advances saw a 13.5% YoY increase to INR 4,067,752 crore from INR 3,584,252 crore, with a 3.75% QoQ growth from INR 3,920,719 crore.
- Asset Quality: The Gross Non-Performing Asset (GNPA) ratio improved to 2.07% in Q3 FY’25, down from 2.42% YoY and 2.13% QoQ. The Net Non-Performing Asset (NNPA) ratio declined to 0.53% from 0.64% YoY, remaining flat QoQ from 0.53%.
- Provision Coverage Ratio: The Provision Coverage Ratio (PCR) increased to 74.66% in Q3 FY’25 from 74.17% YoY, but slightly decreased from 75.66% QoQ, indicating the bank’s strong provisioning for potential loan losses.
- CASA Ratio: The CASA ratio decreased to 39.20% in Q3 FY’25, down from 41.18% in Q3 FY’24 and 40.03% in Q2 FY’25. Despite this decline, it remains healthy, supporting stable profitability and liquidity.
Profit and Loss Statement:
| Particulars (in Cr) | FY24 | FY23 | FY22 |
| INCOME | |||
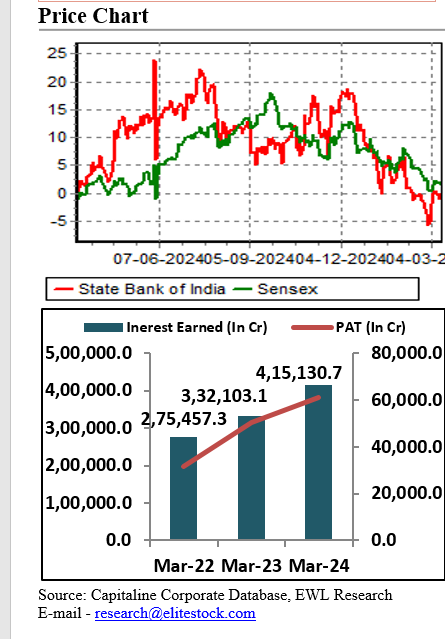
| Interest Earned | 415130.7 | 332103.1 | 275457.3 |
| Other Income | 51682.16 | 36615.6 | 40563.91 |
| Total | 466812.8 | 368718.7 | 316021.2 |
| Expenditure | |||
| Interest expended | 255254.83 | 187262.56 | 154749.7 |
| Payments to/Provisions for Employees | 78336.98 | 57291.84 | 57561.99 |
| Operating Expenses & Administrative Expenses | 16169.29 | 14639.05 | 13590.8 |
| Depreciation | 3351.92 | 3297.27 | 3248.59 |
| Other Expenses, Provisions & Contingencies | 31916.84 | 39022.3 | 43448.28 |
| Total | 385029.9 | 301513 | 272599.4 |
| EBT | 81782.96 | 67205.64 | 43421.84 |
| Tax | 20706.34 | 16973.19 | 11745.87 |
| PAT | 61076.62 | 50232.45 | 31675.97 |
Balance Sheet:
| Particulars (In Cr) | FY24 | FY23 | FY22 |
| SOURCES OF FUNDS | |||
| Capital | 892.46 | 892.46 | 892.46 |
| Reserves | 376354.07 | 326715.99 | 279195.6 |
| Deposits | 4916076.77 | 4423777.78 | 4051534.12 |
| Borrowings | 597560.91 | 493135.16 | 426043.38 |
| Other Liabilities & Provisions | 301906.03 | 283523.16 | 240429.03 |
| TOTAL LIABILITIES | 6192790 | 5528045 | 4998095 |
| APPLICATION OF FUNDS | |||
| Cash & Balances with RBI | 225141.7 | 247087.58 | 318265.21 |
| Balances with Banks & money at Call | 85660.29 | 60812.04 | 76287.11 |
| Investments | 1671339.66 | 1570366.23 | 1481445.47 |
| Advances | 3703970.85 | 3199269.3 | 2733966.59 |
| Fixed Assets | 42617.25 | 42381.8 | 37708.16 |
| Other Assets | 464060.49 | 408127.6 | 350422.05 |
| TOTAL ASSETS | 6192790 | 5528045 | 4998095 |
Cash Flow Statement:
| Particulars (In Cr) | FY24 | FY23 | FY22 |
| Cash and Cash Equivalents at Beginning of the year | 307899.6 | 394552.3 | 343038.7 |
| Net Cash from Operating Activities | 19021.89 | -91351.82 | 58415.45 |
| Net Cash Used in Investing Activities | -2264.15 | -502.65 | -1724.33 |
| Net Cash Used in Financing Activities | -13855.37 | 5201.76 | -5177.51 |
| Net Inc/(Dec) in Cash and Cash Equivalent | 2902.37 | -86652.7 | 51513.61 |
| Cash and Cash Equivalents at End of the year | 310802 | 307899.6 | 394552.3 |
Outlook:
SBI is the largest public sector bank in India, offering a wide range of banking and financial services. With a strong domestic and international presence, SBI serves millions of customers through its extensive network of branches and digital platforms. The bank’s strong performance in Q3FY25 demonstrates its financial resilience, with a 10% YoY increase in interest earned and a 13.5% growth in total advances, highlighting its consistent revenue generation. SBI’s asset quality has also shown significant improvement, with a decline in both Gross Non-Performing Asset (GNPA) and Net Non-Performing Asset (NNPA) ratios, reflecting effective credit risk management and bolstering its financial stability.
Despite a slight dip in the CASA ratio, SBI’s liquidity and funding position remain solid, supporting its ability to navigate market fluctuations. The bank’s management is confident about sustaining a healthy Net Interest Margin (NIM) and stable credit cost guidance, which reinforces its long-term profitability outlook.
With a diversified portfolio spanning retail, corporate, and government banking, coupled with a strong push towards digital transformation, SBI is well-positioned to capitalize on emerging growth opportunities. The ongoing improvement in asset quality, robust financials, and strategic positioning in key market segments support its growth trajectory.
In the last 9 months, SBI reported an EPS of ₹58.56 and total earnings of ₹342,823.16 crore. The bank is trading at P/Ex of 8.39, the bank is positioned for better performance in FY25. Based on strong fundamentals and growth potential, we recommend a “Buy” on SBI with a target price of ₹950 with time horizon of next 9-12 months.
Source: Company website, EWL Research
Disclosure in pursuance of Section 19 of SEBI (RA) Regulation 2014
Elite Wealth Limited does/does not do business with companies covered in its research reports. Investors should be aware that the Elite Wealth Limited may/may not have a conflict of interest that could affect the objectivity of this report. Investors should consider this report as only information in making their investment decision and must exercise their own judgment before making any investment decision.
For analyst certification and other important disclosures, see the Disclosure Appendix, or go to www.elitewealth.in. Analysts employed by Elite Wealth Limited are registered/qualified as research analysts with SEBI in India. (SEBI Registration No.: INH100002300)
Disclosure Appendix
Analyst Certification (For Reports)
Vindhyachal Prasad, Elite Wealth Limited, vindhyachal@elitestock.com
The analyst(s) certify that all of the views expressed in this report accurately reflect my/our personal views about the subject company or companies and its or their securities. I/We also certify that no part of my compensation was, is or will be, directly or indirectly, related to the specific recommendations or views expressed in this report. Unless otherwise stated, the individuals listed on the cover page of this report are analysts in Elite Wealth Limited.
As to each individual report referenced herein, the primary research analyst(s) named within the report individually certify, with respect to each security or issuer that the analyst covered in the report, that:
- all of the views expressed in the report accurately reflect his or her personal views about any and all of the subject securities or issuers; and
- No part of any of the research analyst’s compensation was, is, or will be directly or indirectly related to the specific recommendations or views expressed in the For individual analyst certifications, please refer to the disclosure section at the end of the attached individual notes.
Research Excerpts
This note may include excerpts from previously published research. For access to the full reports, including analyst certification and important disclosures, investment thesis, valuation methodology, and risks to rating and price targets, please visit www.elitewealth.in.
Company-Specific Disclosures
Important disclosures, including price charts, are available and all Elite Wealth Limited covered companies by visiting https://www.elitewealth.in, or emailing research@elitestock.com with your request. Elite Wealth Limited may screen companies based on Strategy, Technical, and Quantitative Research. For important disclosures for these companies, please e-mail research@elitestock.com.
Options related research:
If the information contained herein regards options related research, such information is available only to persons who have received the proper option risk disclosure documents. For a copy of the risk disclosure documents, please contact your Broker’s Representative or visit the OCC’s website at https://www.elitewealth.in
Other Disclosures
All research reports made available to clients are simultaneously available on our client websites. Not all research content is redistributed, e-mailed or made available to third-party aggregators. For all research reports available on a particular stock, please contact your respective broker’s sales person.
Ownership and material conflicts of interest Disclosure
Elite Wealth Limited policy prohibits its analysts, professionals reporting to analysts from owning securities of any company in the analyst’s area of coverage. Analyst compensation: Analysts are salary based permanent employees of Elite Wealth Limited. Analyst as officer or director: Elite Wealth Limited policy prohibits its analysts, persons reporting to analysts from serving as an officer, director, board member or employee of any company in the analyst’s area of coverage.
Country Specific Disclosures
India – For private circulation only, not for sale. Legal Entities Disclosures
Mr. Ravinder Parkash Seth is the Managing Director of Elite Wealth Ltd (EWL, henceforth), having its registered office at Casa Picasso, Golf Course Extension, Near Rajesh Pilot Chowk, Radha Swami, Sector-61, Gurgaon-122001 Haryana, is a SEBI registered Research Analyst and is regulated by Securities and Exchange Board of India. Telephone: 011-43035555, Facsimile: 011-22795783 and Website: www.elitewealth.in
EWL discloses all material information about itself including its business activity, disciplinary history, the terms and conditions on which it offers research report, details of associates and such other information as is necessary to take an investment decision, including the following:
- Reports
- a) EWL or his associate or his relative has no financial interest in the subject company and the nature of such financial interest;
- EWL or its associates or relatives, have no actual/beneficial ownership of one %. or more in the securities of the subject company, at the end of the month immediately preceding the date of publication of the research report or date of the public appearance;
- EWL or its associate or his relative, has no other material conflict of interest at the time of publication of the research report or at the time of public appearance;
- Compensation
- EWL or its associates have not received any compensation from the subject company in the past twelve months;
- EWL or its associates have not managed or co-managed public offering of securities for the subject company in the past twelve months;
- EWL or its associates have not received any compensation for investment banking or merchant banking or brokerage services from the subject company in the past twelve months;
- EWL or its associates have not received any compensation for products or services other than investment banking or merchant banking or brokerage services from the subject company in the past twelve months;
- EWL or its associates have not received any compensation or other benefits from the Subject Company or third party in connection with the research
- In respect of Public Appearances
- EWL or its associates have not received any compensation from the subject company in the past twelve months;
The subject company is not now or never a client during twelve months preceding the date of distribution of the research report and the types of services provided by EWL