
Larsen & Toubro Limited (L&T) is one a leading private sector enterprise with expertise in technology, EPC, and manufacturing. The company has earned a strong reputation for its customer-centric approach and commitment to world-class quality, which has enabled it to lead across its core business areas. With a global presence, L&T is a USD 27 billion multinational engaged in Engineering, Procurement, and Construction (EPC) projects, hi-tech manufacturing, and various services. The company’s relentless pursuit of excellence, innovation, and quality has been central to its continued leadership in the industry, establishing it as a trusted partner in delivering large-scale projects and solutions across diverse sectors worldwide.
| Recommendation
ACCUMULATE |
Accumulation Price
Rs. 3,150-3,100 |
Target Price
Rs. 4200 |
Time Horizon
12 Months |
| Stock Details | |
| Market Cap. (Cr.) | 4,47,061 |
| Equity (Cr.) | 275 |
| Face Value | 2 |
| 52 Wk. high/low | 3,964 / 2,965 |
| BSE Code | 500510 |
| NSE Code | LT |
| Book Value (Rs) | 649 |
| Industry | Engineering – Turnkey Services |
| P/E | 31.2 |
Price Chart
Key Investment Rationale:
- Order Inflows: As of December 2024, the company’s order book stands at Rs 5.64 trillion, reflecting a 20% increase compared to December 2023. The Projects & Manufacturing business, which is predominantly India-centric, comprises 58% of the order book from domestic markets and 42% from international markets. Of the international order book of Rs 2.37 trillion, approximately 84% is derived from the Middle East, 3% from Africa, and the remaining 13% from other global regions.
- Key Acquisitions & Strategic Partnerships: L&T made significant developments in the IT and energy sectors, including LTTS acquiring Intelliswift for USD 110 million to strengthen its software product development, platform engineering, and AI capabilities. Additionally, L&T Data Centre partnered with E2E Networks to implement Gen AI solutions, enhancing its technology offerings.
- Energy & Green Tech Initiatives: L&T Energy Green Tech Limited has won 90,000 MTPA green hydrogen capacity in the tranche 2 of the green hydrogen production PLI at an average incentive of Rs 11.11 per kg of hydrogen. This incentive to be distributed over a period of 3 years will aggregate to a total benefit of around Rs 300 crores.
- Focus on International Markets: International order inflows accounted for 42% of L&T’s total order book, reflecting its strong global presence. Significant orders came from the Middle East, driven by investments in oil, gas, infrastructure, and energy transition projects, providing opportunities for future growth in the region.
- Technology & Digital Transformation: L&T’s emphasis on technology, through LTTS and LTIMindtree, is evident in record deal wins and expansion into digital transformation services. The acquisition of Intelliswift and strategic AI partnerships further solidify L&T’s commitment to enhancing its digital capabilities and staying ahead of industry trends.
Business Model
EPC Projects:- EPC Projects focus on the proven core competencies of conceptualising, designing, executing, and commissioning large, complex projects in the areas of mobility infrastructure, power transmission and distribution, water and irrigation infrastructure, buildings and factories, metals and mining, energy generation & storage solutions, oil & gas, and energy transition.
Hi-Tech Manufacturing:- Hi-Tech Manufacturing focusses on custom-designed and built equipment catering to process plants for various sectors (including nuclear), precision engineering and systems for the defence & aerospace sectors, electrolysers for hydrogen production, industrial and bulk material handling, construction machinery and mining equipment, and industrial valves.
Services:- The Services businesses cater to sectors of IT (through LTIMindtree), Engineering R&D (through LTTS), financial services (through L&T Finance), real estate development (through L&T Realty), B2B E-commerce (through L&T-SuFin), skilling and assessment (through L&T EduTech), data/cloud services (through L&T-Cloudfiniti) and fabless chip design (through L&T Semiconductor Technologies).
Management Commentary on the business & its future prospects:
- L&T secured a 5.2 GW solar project in the UAE, marking a major renewable energy investment. The project, in partnership with Power China, strengthens L&T’s presence in the renewable energy sector.
- L&T is cautious about short-term defense orders, with no immediate prospects expected. It received a repeat order worth Rs 6,500 crores for the Vajra project, maintaining a positive long-term defense outlook.
- L&T’s CarbonLite business secured Rs 23,000 crores in orders for 4 GW ultra-mega plants. This includes BTG components and will contribute to expanding the company’s renewable energy portfolio with future EBITDA recognition.
- EBITDA margins declined due to lower-margin P&M revenue and reduced IT&TS margins. L&T expects margin recovery as the year progresses, with improved revenue composition and stabilization in subsequent quarters.
- L&T’s order book remains strong, especially in Projects & Manufacturing. Large contracts, including a Rs 500 billion order, are key to revenue targets but may face delays or slippages into future quarters.
- L&T’s Telangana metro project receives Rs 3,000 crores in soft loans, with Rs 900 crores disbursed. Further disbursements and TOD monetization aim to reduce third-party debt and lower interest costs.
Q3FY25 Result Analysis
- Revenue Performance: The company reported a revenue from operations of ₹64,667.78 crore in Q3 FY ’25, reflecting a growth of 17.3% from ₹55,127.82 crore in Q3 FY ’24 on a YoY basis. On a QoQ basis, the revenue increased by 5.06% from ₹61,554.58 crore in Q2 FY ’25, showcasing consistent growth and operational efficiency. This performance highlights the company’s strong sales momentum and ability to drive revenue growth in a competitive market.
- Profit After Tax (PAT): The company achieved a profit after tax (PAT) of ₹4,001.03 crore in Q3 FY ’25, marking an 11.3% growth compared to ₹3,594.51 crore in Q3 FY ’24. On a QoQ basis, PAT showed a slight decline of 2.7% from ₹4,112.81 crore in Q2 FY ’25. Despite the QoQ dip, the YoY increase reflects improved profitability and effective cost management, reinforcing the company’s strong earnings capacity.
- EBITDA Performance: EBITDA for Q3 FY ’25 stood at ₹7,898.16 crore, representing a growth of 9.7% from ₹7,198.65 crore in Q3 FY ’24 on a YoY basis. However, on a QoQ basis, EBITDA declined marginally by 0.23% from ₹7,917.05 crore in Q2 FY ’25. The YoY growth demonstrates improved operational performance, while the slight QoQ decline indicates a stable but slightly moderated performance in the most recent quarter.
- EBITDA Margin: The EBITDA margin for Q3 FY ’25 was 12.21%, showing a decrease from 13.06% in Q3 FY ’24 on a YoY basis, and from 12.86% in Q2 FY ’25 on a QoQ basis. While the margin has seen a reduction, it reflects the company’s ability to maintain operational efficiency and profitability despite external pressures. The lower margin on a YoY and QoQ basis is largely driven by increased costs and economic conditions.
Profit and Loss Statement:
| Particulars (In Cr) | FY24 | FY23 | FY22 |
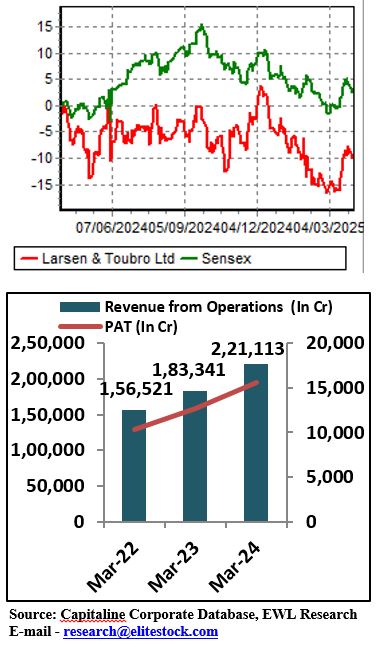
| Revenue From Operations | 221112.91 | 183340.7 | 156521.23 |
| Other Income | 4158.03 | 2929.17 | 2267.08 |
| Total Revenue | 225270.94 | 186269.88 | 158788.31 |
| EXPENSES: | |||
| Cost of Material Consumed | 74256.22 | 62232.46 | 50607.05 |
| Purchases of Stock-in-Trade | 1063.77 | 1052.86 | 1069.5 |
| Changes in Inventories | 1021.07 | -3156.64 | -2076.6 |
| Employee Benefits / Salaries & other Staff Cost | 41171.02 | 37214.11 | 29695.79 |
| Finance Cost | 9260.75 | 9233.6 | 9078.24 |
| Depreciation and Amortization | 3682.33 | 3502.25 | 2947.95 |
| Other Expenses | 74392.28 | 59218.19 | 53068.34 |
| Total Expenses | 204847.44 | 169296.83 | 144390.27 |
| Profit Before Exceptional Items and Tax | 20423.5 | 16973.04 | 14398.04 |
| Exceptional Items Before Tax | 93.61 | 135.99 | 96.93 |
| EBT | 20517.11 | 17109.03 | 14494.97 |
| Tax | 4947.39 | 4484.16 | 4203.92 |
| PAT | 15569.72 | 12624.87 | 10291.05 |
Balance Sheet:
| Particulars (In Cr) | 202403 | 202303 | 202203 |
| SOURCES OF FUNDS : | |||
| Share Capital | 274.93 | 281.1 | 496.66 |
| Reserves Total | 86084.31 | 89044.85 | 82126.65 |
| Total Shareholders’ Funds | 86359.24 | 89325.95 | 82623.31 |
| Minority Interest | 16190.42 | 14241.27 | 12966.07 |
| Secured Loans | 78930.87 | 81689.18 | 80290.25 |
| Unsecured Loans | 37391.35 | 38961.26 | 45002.18 |
| Total Debt | 116322.22 | 120650.44 | 125292.43 |
| Other Liabilities | 1701.47 | 1224.68 | 961.98 |
| Total Liabilities | 220573.35 | 225442.34 | 221843.79 |
| APPLICATION OF FUNDS : | |||
| Net Block | 42963.82 | 42641 | 42945.01 |
| Capital Work in Progress | 3045.01 | 3065.57 | 1249.55 |
| Investments | 45647.82 | 44798.31 | 39395.18 |
| Current Assets, Loans & Advances | |||
| Inventories | 6620.19 | 6828.78 | 5943.32 |
| Sundry Debtors | 48770.95 | 44731.53 | 46139.32 |
| Cash and Bank | 15358.39 | 22519.6 | 18953.17 |
| Loans and Advances | 111367.35 | 111562.19 | 107367.69 |
| Total Current Assets | 182116.88 | 185642.1 | 178403.5 |
| Less : Current Liabilities and Provisions | |||
| Current Liabilities | 113202.28 | 99392.61 | 92518.44 |
| Provisions | 5317.98 | 4886.93 | 4665.68 |
| Total Current Liabilities | 118520.26 | 104279.54 | 97184.12 |
| Net Current Assets | 63596.62 | 81362.56 | 81219.38 |
| Deferred Tax Assets | 11272.1 | 10357.15 | 9610.4 |
| Deferred Tax Liability | 7942.01 | 7002.79 | 7809.63 |
| Net Deferred Tax | 3330.09 | 3354.36 | 1800.77 |
| Other Assets | 61989.99 | 50220.54 | 55233.9 |
| Total Assets | 220573.35 | 225442.34 | 221843.79 |
Cash Flow Statement:
| Particulars (Cr.) | 202403 | 202303 | 202203 |
| Cash Flow Summary | |||
| Cash and Cash Equivalents at Beginning of the year | 16926.69 | 13770.24 | 13373.52 |
| Net Cash from Operating Activities | 18266.28 | 22776.96 | 19163.58 |
| Net Cash Used in Investing Activities | 2178.89 | -8048.02 | -3585.38 |
| Net Cash Used in Financing Activities | -25413.36 | -11572.49 | -15181.48 |
| Net Inc/(Dec) in Cash and Cash Equivalent | -4968.19 | 3156.45 | 396.72 |
| Cash and Cash Equivalents at End of the year | 11958.5 | 16926.69 | 13770.24 |
Outlook:
Larsen & Toubro Limited (L&T) is one a leading private sector enterprise with expertise in technology, EPC, and manufacturing. The company is known for its commitment to quality and innovation, the company executes large-scale projects across various sectors. With a growing international presence, L&T continues to strengthen its leadership in global engineering and construction through strategic expansion.
In the last nine months, the company has reported a revenue of Rs 18, 1342 crore, which is up 17.7% on a YoY basis, in same period the company has reported PAT of Rs 11,553.95 crore which is up 9.3% on a YoY basis, EBITDA margin during the period remain at 12.61%. In the last nine months, it has recorded an EPS of Rs 69.38, compared to the EPS of Rs 55.85 in FY24 and based on TTM earnings the company is currently trading at a P/Ex of 31.2.
Given the company’s robust financial performance, Strong Order Book, Expansion in international and domestic market and the outlook for Q4FY25, we believe L&T is well-positioned for continued growth.
Based on these factors, we recommend an Accumulate rating with a price range of Rs 3,150-3,100, for the target price of Rs 4,200 within the next 12 months.
Source: Company website, EWL Research
Disclosure in pursuance of Section 19 of SEBI (RA) Regulation 2014
Elite Wealth Limited does/does not do business with companies covered in its research reports. Investors should be aware that the Elite Wealth Limited may/may not have a conflict of interest that could affect the objectivity of this report. Investors should consider this report as only information in making their investment decision and must exercise their own judgment before making any investment decision.
For analyst certification and other important disclosures, see the Disclosure Appendix, or go to www.elitewealth.in. Analysts employed by Elite Wealth Limited are registered/qualified as research analysts with SEBI in India. (SEBI Registration No.: INH100002300)
Disclosure Appendix
Analyst Certification (For Reports)
Vindhyachal Prasad, Elite Wealth Limited, vindhyachal@elitestock.com
The analyst(s) certify that all of the views expressed in this report accurately reflect my/our personal views about the subject company or companies and its or their securities. I/We also certify that no part of my compensation was, is or will be, directly or indirectly, related to the specific recommendations or views expressed in this report. Unless otherwise stated, the individuals listed on the cover page of this report are analysts in Elite Wealth Limited.
As to each individual report referenced herein, the primary research analyst(s) named within the report individually certify, with respect to each security or issuer that the analyst covered in the report, that:
- all of the views expressed in the report accurately reflect his or her personal views about any and all of the subject securities or issuers; and
- No part of any of the research analyst’s compensation was, is, or will be directly or indirectly related to the specific recommendations or views expressed in the For individual analyst certifications, please refer to the disclosure section at the end of the attached individual notes.
Research Excerpts
This note may include excerpts from previously published research. For access to the full reports, including analyst certification and important disclosures, investment thesis, valuation methodology, and risks to rating and price targets, please visit www.elitewealth.in.
Company-Specific Disclosures
Important disclosures, including price charts, are available and all Elite Wealth Limited covered companies by visiting https://www.elitewealth.in, or emailing research@elitestock.com with your request. Elite Wealth Limited may screen companies based on Strategy, Technical, and Quantitative Research. For important disclosures for these companies, please e-mail research@elitestock.com.
Options related research:
If the information contained herein regards options related research, such information is available only to persons who have received the proper option risk disclosure documents. For a copy of the risk disclosure documents, please contact your Broker’s Representative or visit the OCC’s website at https://www.elitewealth.in
Other Disclosures
All research reports made available to clients are simultaneously available on our client websites. Not all research content is redistributed, e-mailed or made available to third-party aggregators. For all research reports available on a particular stock, please contact your respective broker’s sales person.
Ownership and material conflicts of interest Disclosure
Elite Wealth Limited policy prohibits its analysts, professionals reporting to analysts from owning securities of any company in the analyst’s area of coverage. Analyst compensation: Analysts are salary based permanent employees of Elite Wealth Limited. Analyst as officer or director: Elite Wealth Limited policy prohibits its analysts, persons reporting to analysts from serving as an officer, director, board member or employee of any company in the analyst’s area of coverage.
Country Specific Disclosures
India – For private circulation only, not for sale. Legal Entities Disclosures
Mr. Ravinder Parkash Seth is the Managing Director of Elite Wealth Ltd (EWL, henceforth), having its registered office at Casa Picasso, Golf Course Extension, Near Rajesh Pilot Chowk, Radha Swami, Sector-61, Gurgaon-122001 Haryana, is a SEBI registered Research Analyst and is regulated by Securities and Exchange Board of India. Telephone: 011-43035555, Facsimile: 011-22795783 and Website: www.elitewealth.in
EWL discloses all material information about itself including its business activity, disciplinary history, the terms and conditions on which it offers research report, details of associates and such other information as is necessary to take an investment decision, including the following:
- Reports
- a) EWL or his associate or his relative has no financial interest in the subject company and the nature of such financial interest;
- EWL or its associates or relatives, have no actual/beneficial ownership of one %. or more in the securities of the subject company, at the end of the month immediately preceding the date of publication of the research report or date of the public appearance;
- EWL or its associate or his relative, has no other material conflict of interest at the time of publication of the research report or at the time of public appearance;
- Compensation
- EWL or its associates have not received any compensation from the subject company in the past twelve months;
- EWL or its associates have not managed or co-managed public offering of securities for the subject company in the past twelve months;
- EWL or its associates have not received any compensation for investment banking or merchant banking or brokerage services from the subject company in the past twelve months;
- EWL or its associates have not received any compensation for products or services other than investment banking or merchant banking or brokerage services from the subject company in the past twelve months;
- EWL or its associates have not received any compensation or other benefits from the Subject Company or third party in connection with the research
- In respect of Public Appearances
- EWL or its associates have not received any compensation from the subject company in the past twelve months;
The subject company is not now or never a client during twelve months preceding the date of distribution of the research report and the types of services provided by EWL