
| Recommendation | CMP | Target Price | Time Horizon |
| Accumulate | Rs. 711 | Rs. 945 | 12 Months |
ICICI Bank is an Indian multinational bank and financial services company with its corporate office in Mumbai, Maharashtra. It offers a wide range of banking products and financial services for corporate and retail customers through a variety of delivery channels and subsidiaries in the areas of investment banking, life, non-life insurance, venture capital and asset management. ICICI Bank is the second largest Private bank of the country with the loan book of around 11 lakhs crore. Under the new leadership of Mr Sandeep Bakhshi bank performance has improved drastically as loan growth is finally coming back, margins improving and NPA condition is finally improving.
Stock Details |
|
| Market Cap. (Cr.) | 494499.00 |
| Face Value | 2.00 |
| Equity (Cr.) | 1383.41 |
| 52 Wk. high/low | 860/531 |
| BSE Code | 532174 |
| NSE Code | ICICIBANK |
| Book Value (Rs) | 247.30 |
| Industry | Private Bank |
| P/E | 22.05 |
Share Holding Pattern % |
|
Promoter |
– |
| FIIs | 56.24 |
| Institutions | 12.46 |
| Non Promoter Corp. | 22.55 |
| Public & Others
Government |
8.56
0.19 |
| Total | 100.00 |
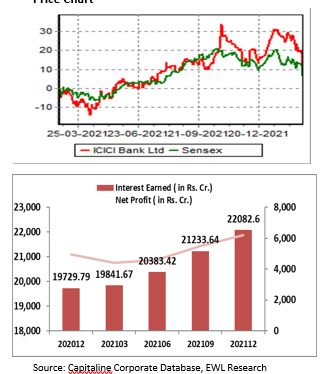
Price Chart
Key Investment Rationale:
-
In last 12 quarter performance of ICICI Bank is consistently improving which is the biggest reason street has turn positive on this bank, one of the target of new management was to achieve 15% RoE which has been accomplished in this quarter. The next leg will aim to sustain and improve on this RoE further.
-
Stability of the top management has helped the bank in improving their operational performance. Sandeep Bakhshi’s appointment as CEO brought stability which has improved financials and stock performance and re-rated the bank performance as bank delivered 31% CAGR in m-cap since FY18-21 v/s 7% over FY10-18.
-
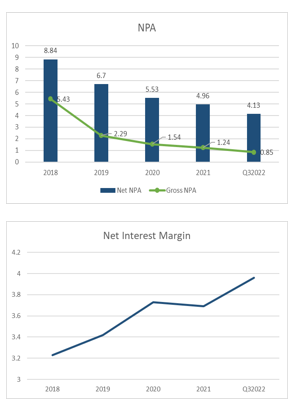
Gross NPA of the bank was 5.42% on 31st Dec 2020, which has fallen to 4.13% in December quarter 2021, net NPA consistently falling from 1.26% to 0.85%, and provision coverage ratio has also improved from 77.6% to 80.1%.
-
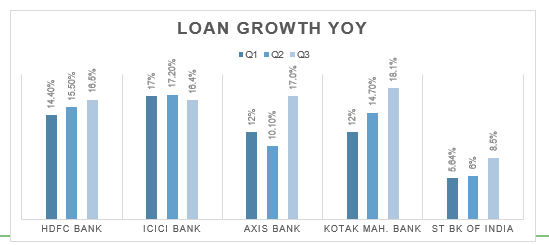
One of the biggest improvement seen in last few years in that ICICI Bank is leading the credit growth in the country .In December quarter Domestic loan growth of the bank was 17.9% which is higher than other private Bank. Bank deposit franchisee is also improving as CASA ratio now stand at 44.9%.
-
ICICI Bank is investing heavily on technology, which is helping bank in acquiring new customer and gaining traction among its customer as iMobile pay transaction has gone up 3.3x.
-
In Q3FY22 Retail loans grew 19% YoY and 5% QoQ, within which Home/Personal loans grew 5%/8% QoQ. Growth in Credit Cards/Vehicle loan book stood at 15%/4% QoQ
-
ICICI Bank has very strong capital position as it has capital adequacy of 18.33%, so bank don’t have to dilute in near term.
-
ICICI Bank has a very valuable subsidiaries, there subsidiaries are also showing strong performance, Bank can also unlock value from these subsidiaries.
Outlook:
ICICI Bank India’s second largest private sector Bank has been reporting a robust performance, led by strong core pre provision profit, strong loan growth, and steady asset quality. A healthy mix of the high yielding portfolio (Retail/Business Banking) and a low cost liability franchise with strong growth in CASA ratio is aiding margin expansion. The bank is witnessing strong recovery across key segments such as Retail, SME, and Business Banking. With a higher proportion of a floating rate loan book, as the rate cycle turn and RBI start to increase repo rate, we estimate portfolio yields to improve, resulting in buoyant margin. We expect credit growth to pick up in second half of FY23 as capacity utilization level of industries improving and ICICI Bank being the leader is going to be benefited by credit expansion. At CMP ICICI trade at 3.1x P/B on FY22 Book value, which is at discount compared to other peers like Kotak & HDFC Bank and value of its subsidiaries is ₹200 per share. So valuing the bank at 3.5x FY23 book value, we recommend BUY for the Target Price of ₹ 945.
Business Overview
Retail Banking
Banking Business registered robust growth and emerged as a key driver for retail business in the first 9month of FY22. Total Retail Deposits grew by 22.3 per cent to ₹7,09,085 crore from Rs.5,80,006 crore in the preceding year while Retail Advances rose by 18.6% to ₹ 502420 crore from ₹ 423783 crore. The Personal Loan Business surged to nearly 56963 crore on the back of strong product offering and market share gain. ICICI Bank is gaining market share in the Auto Loans saw a growth of 5.5% in Q3FY22.In credit card segment bank saw a robust growth of 32% in Q3FY22, ICICI also gaining market share because of embargo on HDFC Bank and because of their partnership with Amazon. ICICI Bank issued total 12.4 million cards, and cards spend has increased almost 2.2x YoY in Q3FY22.Credit card spend market share has improved form 20.1% to 20.8% in third quarter of FY22.
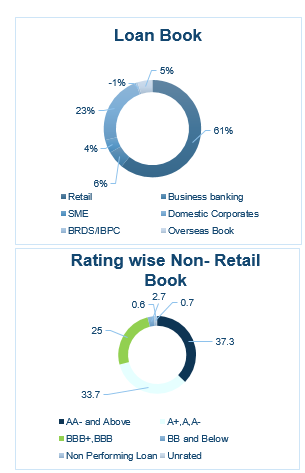
Wholesale Banking
Wholesale Banking business focuses on institutional customers such as the Large and Emerging Corporates, SMEs and Government. This Business recorded a healthy 18.9% growth in Q3FY22. ICICI Bank always has a strong wholesale book earlier was projected as a corporate lender, in Q3FY22 corporate book was 33% of the total loan book. The Bank ended the year under review with a domestic loan book size of Rs.276195 crore. Growth in SME business (34.2%, YoY) was mainly driven by the digital offerings and platforms like InstaBIZ (now 1 billion customers) and Merchant STACK. Growth trends has also been witnessed in the number of transactions in UPI-iMobile pay 3.3x, YoY, Scan to pay 3.2x, YoY and Pay to contact 1.5x, QoQ.
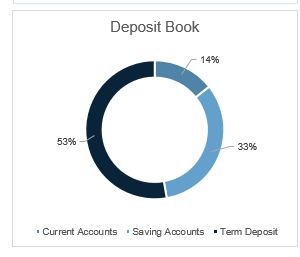
Deposit Book:
ICICI Bank has a very strong liability franchise, of the total deposit book CASA form 47% of the total deposits in Q3FY22 grew 16.4%/4.1% YoY/QoQ led by 20%/25% YoY growth in savings/current account while term deposits grew12% YoY. The average CASA ratio improved by 80bps QoQ.Cost of Deposit of the company in Q3FY22 stand at 4.11%, which is higher by 40bps when compared to 2QFY22.
Restructuring
Over 95% of the loans for restructuring in the retail and business portfolio are secured loans. The bank has made two additional provisions in the third quarter, i.e. restructured provisions worth ₹4500 and provision on security receipt book for ₹4500 crore
Asset Quality:
The net non-performing assets declined by 10% sequentially to 7,344 crore at December 31, 2021 from 8,161 crore at September 30, 2021. The net NPA ratio declined to 0.85% at Dec 312021 from 0.99% at September 30, 2021. During Q3-2022, there were net deletions from gross NPAs of 191 crore, excluding write-offs and sale, compared to net additions of 96 crore in Q2-2022. The gross NPA additions declined to ` 4,018 crore in Q3-2022 from ₹ 5,578 crore in Q2-2022 and ` 7,231 crore in the quarter ended June 30, 2021. Recoveries and upgrades of NPAs, excluding write-offs and sale, were 4,209 crore in Q3-22. The gross NPAs written-off were 4,088 crore
Net Interest Income:
ICICI Bank NIM are consistently improving from 3.23% in FY20 FY18 to 3.96% in FY22, In Q3FY22 income tax refund during the quarter amounted to 6bps on NIM compared to 1bps in Q2FY22. Liquidity Coverage Ratio was 130% for the quarter. The cost of deposits remains low at 3.47%, down 6bps QoQ and the management has indicated that it has bottomed out. Yields on advances have declined 15bps QoQ to 8.19% in Q3FY22. 38% of the domestic loan book is linked to the repo rate and 7% to other external benchmarks. The management is looking to maintain NIM at 9MFY22 levels.
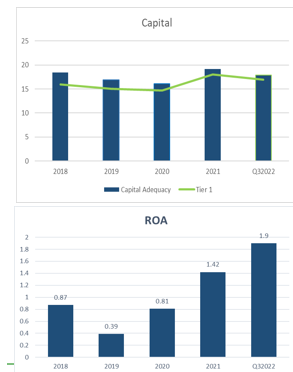
Capital Adequacy:
Bank has a very strong capital adequacy of 17.91% of which 16.93% is Tier 1 capital. ICICI Bank has enough capital for next 2 year and they will not diluted there equity in near future.
ROA:
One of the biggest improvement under the new management is improvement in ROA and ROE of the bank, ROA of the bank improved from 0.84% in FY18 to 1.9% in Q3FY22 and management has guided to improve ROA to 2%.ROE of the bank improved from 6.8% in FY18 to 14.5 in Q3FY22
Digital initiatives:
Technological expenses comprised 8.2% of the non-employee costs for 9MFY22.
The value of financial transactions on InstaBIZ for SME and Business Banking rose 68% YoY. The value of transactions through supply chain platforms increased 3.5x YoY in 3QFY22.
About 33%/43% of the home/personal loans were end-to-end digital in 9MFY22.
ICICI BANK SUBSIDIARIES:
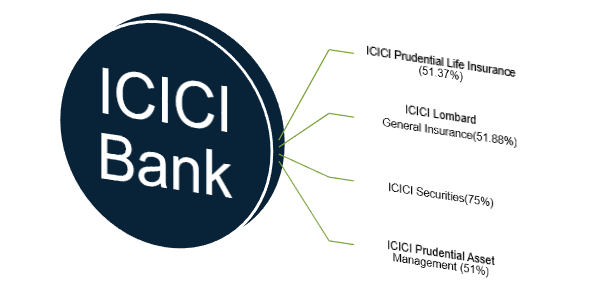
ICICI Bank Prudential Life Insurance: ICICI Prudential Life Insurance Co. Ltd. is a joint venture between ICICI Bank and Prudential Corp. Holdings. The issuer offers protection for life and health along with pension products and services. In Q3FY22 gross premium up 2.1% YoY to Rs. 9,344cr and net premium up 1.1% YoY to Rs. 9,074cr, supported by well diversified product and distribution mix. VNB grew 34.8% YoY to Rs. 1,388cr in 9MFY22, aided by strong growth of 29.7% in new business premium during the same period.
ICICI Lombard General Insurance: is a private general insurance company, ICICI Lombard in Q3FY22 reported an in-line Q3 performance; weak growth in motor as well as retail health segments has been the major setback. Also, combined ratios (CoRs) have been elevated for the past few quarters (>105%), as health and motor saw increased claims on the back of steady normalization. It is expected that loss ratios in the health segment to stabilise and remain range-bound, owing to the rapid pace of vaccination and mild nature of the Omicron variant. Gross direct premium income has grown to 13311 Crore in 9M-2022 (9M-2021: ` 10525 crore) . Combined ratio was at 111% in 9M-2022 vs 9MFY21 of 99.1%.
ICICI Securities: Revenue grew by 51.9% to ₹ 942 crore in Q3-2022 from growth across all businesses , New client acquisition of 676,000 in Q3-2022; highest ever quarterly addition ,Overall active clients grew by 89% y-o-y to 3.1 million in Q3-2022 , Profit after tax grew by 41.2% y-o-y to ₹ 1042 crore in 9M-2022.
ICICI Prudential Asset Management: Average AUM grew by 23.0% y-o-y and 4.5% q-o-q to ₹ 4, 67,461 crore in Q3-2022, Profit after tax grew by 22.0% y-o-y to ₹ 1097 crore in 9MFY22.ICICI Prudential AMC is the leading AMC in the country.
(₹ in Crores)
| Balance Sheet | 2021 | 2020 | 2019 | 2018 |
| SOURCES OF FUNDS : | ||||
| Capital | 1383.41 | 1294.76 | 1289.46 | 1285.81 |
| Reserves Total | 156200.99 | 121661.81 | 112959.27 | 109338.32 |
| Minority Interest | 9588.34 | 6794.77 | 6580.54 | 6008.19 |
| Deposits | 959940.02 | 800784.46 | 681316.94 | 585796.11 |
| Borrowings | 143899.94 | 213851.78 | 210324.12 | 229401.83 |
| Other Liabilities & Provisions | 102874.23 | 90315.78 | 77941.26 | 64574.76 |
| Policy Holders Fund | 203180.04 | 145486.25 | 152378.75 | 131488.43 |
| TOTAL LIABILITIES | 1577070.07 | 1380193.1 | 1242795.02 | 1127899.02 |
| APPLICATION OF FUNDS : | ||||
| cash & Balances with RBI | 46302.21 | 35311.93 | 38066.28 | 33272.6 |
| Balances with Banks | 101268.33 | 92540.99 | 49324.62 | 55726.53 |
| Investments | 536578.62 | 443472.63 | 398200.76 | 372207.68 |
| Advances | 791801.39 | 706246.11 | 646961.68 | 566854.22 |
| Fixed Assets | 10809.26 | 10408.66 | 9660.42 | 9465.01 |
| Other Assets | 90310.27 | 92212.78 | 100581.26 | 90372.97 |
| TOTAL ASSETS | 1577070.08 | 1380193.1 | 1242795.02 | 1127899.01 |
| Contingent Liability | 3021344.23 | 3003053.53 | 2612071.93 | 1891035.82 |
| Bills for collection | 54846.38 | 48401.26 | 49579.19 | 28705.41 |
(₹ in Crores)
| Profit And Loss A/c | 2021 | 2020 | 2019 | 2018 |
| INCOME : | ||||
| Interest Earned | 79118.27 | 74798.32 | 63401.19 | 54965.89 |
| Other Income | 18968.53 | 16448.62 | 14512.16 | 17419.63 |
| <strongTotal | 98086.8 | 91246.94 | 77913.35 | 72385.52 |
| Expenditure | ||||
| Interest expended | 40128.84 | 41531.25 | 36386.4 | 31940.05 |
| Payments to/Provisions for Employees | 8091.78 | 8271.24 | 6808.24 | 5913.95 |
| Operating & Administrative Expenses | 5548.34 | 5486.58 | 4849.63 | 4252.34 |
| Depreciation | 1071.79 | 948.54 | 776.91 | 780.74 |
| Other Expenses, Provisions & Contingencies | 23063.32 | 20961.29 | 25315.42 | 22063.89 |
| Provision for Tax | 4665.66 | 3746.03 | 3360.6 | 2661.85 |
| Deferred Tax | -675.62 | 2371.2 | -2947.14 | -2004.72 |
| Total | 81894.12 | 83316.12 | 74550.06 | 65608.1 |
| Profit & Loss | ||||
| Reported Net Profit | 16192.68 | 7930.81 | 3363.3 | 6777.42 |
| Profit brought forward | 21327.47 | 17879.57 | 18495.26 | 18744.94 |
| Transfer to Statutory Reserve | 4048.2 | 1982.8 | 840.9 | 1694.4 |
| Transfer to Other Reserves | 2462.89 | 1854.8 | 2172.96 | 2910.32 |
| Trans. to Government /Proposed Dividend | 0 | 645.31 | 965.13 | 2422.39 |
| Balance carried forward to Balance Sheet | 31009.07 | 21327.47 | 17879.57 | 18495.26 |
| Equity Dividend % | 100 | 0 | 50 | 75 |
| Dividend Per Share (Rs) | 2 | 0 | 1 | 1.5 |
| Earnings Per Share | 23.41 | 12.25 | 5.22 | 10.54 |
| Book Value | 208.78 | 175.15 | 163.35 | 158.89 |
| Key Ratios | 2021 | 2020 | 2019 | 2018 |
| Credit-Deposit (%) | 80.95 | 86.52 | 90.54 | 92.92 |
| Investment / Deposit (%) | 31.16 | 32.11 | 33.84 | 34.68 |
| Cash / Deposit (%) | 4.77 | 5.14 | 5.85 | 6.17 |
| Interest Expended / Interest Earned (%) | 50.72 | 55.52 | 57.39 | 58.11 |
| Other Income / Total Income (%) | 19.34 | 18.03 | 18.63 | 24.07 |
| Operating Expenses / Total Income (%) | 21.98 | 23.69 | 23.06 | 21.46 |
| Interest Income / Total Funds (%) | 6.8 | 7.25 | 6.87 | 6.66 |
| Interest Expended / Total Funds (%) | 3.45 | 4.03 | 3.94 | 3.87 |
| Net Interest Income / Total Funds (%) | 3.35 | 3.22 | 2.93 | 2.79 |
| Non-Interest Income / Total Funds (%) | 1.63 | 1.59 | 1.57 | 2.11 |
| Operating Expenses / Total Funds (%) | 1.85 | 2.1 | 1.95 | 1.88 |
| Profit before Provisions / Total Funds (%) | 3.13 | 2.72 | 2.54 | 3 |
| Net Profit / Total funds (%) | 1.39 | 0.77 | 0.36 | 0.82 |
| RONW (%) | 12.56 | 7.25 | 3.24 | 6.81 |
Industry Overview:
The Banking industry in India has historically been one of the most stable systems globally, despite global upheavals. The government has consistently strived to promote financial inclusion through various initiatives targeted to bring the country’s underbanked population under the banking gamut. Assets of PSUs were nearly 60% of total banking assets. Bank Credit from FY16-20 has registered a CAGR of 3.6% and as of FY20 and total credit extended stand at $1.7 Trillion, deposits has registered a 14% CAGR from $1.15 Trillion (2016) to $2 Trillion (2021).
Indian Banks are expected to do very well for next 2-3 years, as economy is expected to expand in coming years, and ICICI being a leader in private bank is expected to gain market share and do well going forward. NPA are constantly coming down and bank balance sheet is strong enough for next leg of growth. Margins of Indian Banks are expected to improve in coming quarter as interest rate are expected to increase in coming quarter.
Disclosure in pursuance of Section 19 of SEBI (RA) Regulation 2014
Elite Wealth Limited does/does not do business with companies covered in its research reports. Investors should be aware that the Elite Wealth Limited may/may not have a conflict of interest that could affect the objectivity of this report. Investors should consider this report as only information in making their investment decision and must exercise their own judgment before making any investment decision.
For analyst certification and other important disclosures, see the Disclosure Appendix, or go to www.elitewealth.in. Analysts employed by Elite Wealth Limited are registered/qualified as research analysts with SEBI in India.( SEBI Registration No.: INH100002300)
Disclosure Appendix
Analyst Certification (For Reports)
Israil Khan, Elite Wealth Limited, suhail@elitewealth.in
The analyst(s) certify that all of the views expressed in this report accurately reflect my/our personal views about the subject company or companies and its or their securities. I/We also certify that no part of my compensation was, is or will be, directly or indirectly, related to the specific recommendations or views expressed in this report. Unless otherwise stated, the individuals listed on the cover page of this report are analysts in Elite Wealth Limited.
As to each individual report referenced herein, the primary research analyst(s) named within the report individually certify, with respect to each security or issuer that the analyst covered in the report, that:
(1) all of the views expressed in the report accurately reflect his or her personal views about any and all of the subject securities or issuers; and
(2) no part of any of the research analyst’s compensation was, is, or will be directly or indirectly related to the specific recommendations or views expressed in the report.
For individual analyst certifications, please refer to the disclosure section at the end of the attached individual notes.
Research Excerpts
This note may include excerpts from previously published research. For access to the full reports, including analyst certification and important disclosures, investment thesis, valuation methodology, and risks to rating and price targets, please visit www.elitewealth.in.
Company-Specific Disclosures
Important disclosures, including price charts, are available and all Elite Wealth Limited covered companies by visiting https://www.elitewealth.in, or emailing research@elitestock.com with your request. Elite Wealth Limited may screen companies based on Strategy, Technical, and Quantitative Research. For important disclosures for these companies, please e-mail research@elitestock.com.
Options related research:
If the information contained herein regards options related research, such information is available only to persons who have received the proper option risk disclosure documents. For a copy of the risk disclosure documents, please contact your Broker’s Representative or visit the OCC’s website at https://www.elitewealth.in
Other Disclosures
All research reports made available to clients are simultaneously available on our client websites. Not all research content is redistributed, e-mailed or made available to third-party aggregators. For all research reports available on a particular stock, please contact your respective broker’s sales person.
Ownership and material conflicts of interest Disclosure
Elite Wealth Limited policy prohibits its analysts, professionals reporting to analysts from owning securities of any company in the analyst’s area of coverage. Analyst compensation: Analysts are salary based permanent employees of Elite Wealth Limited. Analyst as officer or director: Elite Wealth Limited policy prohibits its analysts, persons reporting to analysts from serving as an officer, director, board member or employee of any company in the analyst’s area of coverage.
Country Specific Disclosures
India – For private circulation only, not for sale.
Legal Entities Disclosures
Mr. Ravinder Parkash Seth is the Managing Director of Elite Wealth Ltd (EWL, henceforth), having its registered office at Casa Picasso, Golf Course Extension, Near Rajesh Pilot Chowk, Radha Swami, Sector-61, Gurgaon-122001 Haryana, is a SEBI registered Research Analyst and is regulated by Securities and Exchange Board of India. Telephone:011-43035555, Facsimile: 011-22795783 and Website: www.elitewealth.in
EWL discloses all material information about itself including its business activity, disciplinary history, the terms and conditions on which it offers research report, details of associates and such other information as is necessary to take an investment decision, including the following:
1. Reports
a) EWL or his associate or his relative has no financial interest in the subject company and the nature of such financial interest;
(b) EWL or its associates or relatives, have no actual/beneficial ownership of one per cent. or more in the securities of the subject company, at the end of the month immediately preceding the date of publication of the research report or date of the public appearance;
(c) EWL or its associate or his relative, has no other material conflict of interest at the time of publication of the research report or at the time of public appearance;
2. Compensation
(a) EWL or its associates have not received any compensation from the subject company in the past twelve months;
(b) EWL or its associates have not managed or co-managed public offering of securities for the subject company in the past twelve months;
(c) EWL or its associates have not received any compensation for investment banking or merchant banking or brokerage services from the subject company in the past twelve months;
(d) EWL or its associates have not received any compensation for products or services other than investment banking or merchant banking or brokerage services from the subject company in the past twelve months;
(e) EWL or its associates have not received any compensation or other benefits from the Subject Company or third party in connection with the research report.
3 In respect of Public Appearances
(a) EWL or its associates have not received any compensation from the subject company in the past twelve months;
(b) The subject company is not now or never a client during twelve months preceding the date of distribution of the research report and the types of services provided by EWL