
Tata Power Company Ltd, a flagship entity of the Tata Group, is one of India’s largest integrated power companies with operations across the power value chain – generation, transmission, distribution, and renewable energy. The company has progressively diversified from conventional thermal power into clean energy, making significant investments in solar, wind, hydro, and green mobility infrastructure. With a total generation capacity of over 14 GW, nearly 40% from renewable sources, Tata Power is well-placed to benefit from India’s energy transition and government focus on sustainability. Its presence in rooftop solar, EV charging infrastructure, and solar EPC solutions further strengthens growth prospects.
| Recommendation
ACCUMULATE |
Accumulation Price
Rs. 380-370 |
Target Price
Rs. 490 |
Time Horizon
12 Months |
| Stock Details | |
| Market Cap. (Cr.) | 1,26,360 |
| Equity (Cr.) | 320 |
| Face Value | 1 |
| 52 Wk. high/low | 495/326 |
| BSE Code | 500400 |
| NSE Code | TATAPOWER |
| Book Value (Rs) | 112 |
| Industry | POWER |
| TTM P/E | 30.54 |
| Share Holding Pattern % | |
| Promoters | 46.86 |
| FIIs | 11.37 |
| Institutions | 16.28 |
| Public & Others | 25.49 |
| Government | 0.01 |
| Total | 100 |
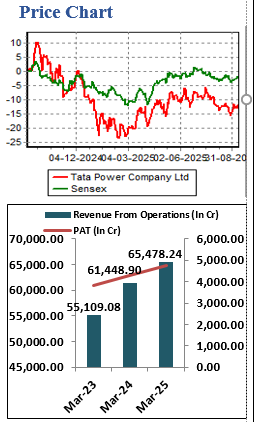
Price Chart
Key Investment Rationale:
- Demand in the rooftop segment is rising rapidly. Tata Power supplied just 1,000 units in March 2024, growing to 20,000 units by June 2025, with expectations to reach 40,000–50,000 units per month later this year. Programs like PM Surya Ghar will drive massive residential adoption. Management stressed that India has 25 crore households, creating enormous long-term demand potential. Tata Power sees rooftop as a multi-year growth engine with both residential and C&I opportunities.
- Tata Power launched India’s largest TATA.ev MegaCharger Hub at Mumbai airport, capable of charging 16 EVs simultaneously using 100% green energy. It operates 5,571 public chargers across 620 cities, targeting 7.5 lakh home chargers and 10,000 public points by 2030. In Q1 FY26, Tata Power added 652 MW renewable capacity. Its EV charging segment sees strong growth, fueled by partnerships with major OEMs and higher utilization rates.
- It is strategically focusing on clean energy for long-term growth. The company has begun work on a pumped hydro project targeted for FY29 and a hydro project in Bhutan slated for 2029. Importantly, it is not pursuing new coal-based capacity but is committed to renewables, pumped hydro, and hydro projects. With a 5.5 GW renewable pipeline and 2.8 GW pumped hydro, these investments promise sustainable returns aligned with its clean energy roadmap.
- It has order book, with Rs 1,242 crore in rooftop solar EPC and Rs 2,735 crore in utility-scale projects, reflecting strong demand. On top of that, the company is investing heavily in transmission in Mumbai to meet rising power needs, spending Rs 600–700 crore annually. Two projects will be commissioned this quarter, and more within 3–4 quarters, ensuring reliable infrastructure and supporting long-term performance growth.
- Tata Power delivered steady performance in Q1 FY26, with EBITDA growth of 16.4% supported by strong contributions from generation, renewables, distribution, and transmission. Revenue rose 5.49% QoQ and 4.3% YoY to Rs 18,035.07 crore, reflecting operational momentum. However, PAT declined 3.35% QoQ to Rs 1,262.32 crore, mainly due to regulatory deferral adjustments. On a YoY basis, PAT still improved 6.2%, highlighting underlying profitability despite short-term regulatory impact.
Business Model
- RENEWABLES: – Tata Power’s Renewables business plays a vital role in addressing India’s growing energy demands, while playing a significant role in the nation’s clean energy transition. It’s Renewables cluster includes large-scale solar, wind, and hybrid projects, as well as the manufacturing of solar modules and cells, alongside solar engineering, procurement, and construction (EPC).
- Renewable Energy: With its utility-scale solar, wind, and hybrid assets, along with strong EPC capabilities, is well-positioned to contribute significantly to India’s growing energy requirements through sustainable solutions. It has a total renewable energy capacity of 10.9 GW, including 5.4 GW under construction, and maintains a robust solar utility-scale EPC order book of Rs 3,977 crore.
- Wind & Solar Energy: Harnessing two of the world’s fastest-growing renewable sources, the company converts wind and solar power into clean electricity, accelerating the transition to a sustainable future. It operates a total wind capacity of 1,034 MW and a solar capacity of 4,516 MW.
- Solar Manufacturing: It is pioneering solar manufacturing with cutting-edge technology, fostering indigenous production, and strengthening the complete solar value chain while ensuring seamless customer support. It operates an integrated solar cell and module manufacturing plant with a capacity of 9 GW.
- THERMAL & HYDRO: Manage hydropower and conventional power facilities with a combined 10,183 MW of capacity in North, West, and East India. In order to provide customers with reliable and reasonably priced electricity while managing the changes in energy dynamics, it focuses on the safe and competitive management of these assets. The company is dedicated to producing energy in an efficient and sustainable manner, minimizing its negative effects on the environment while meeting India’s expanding energy demands.
- Thermal Energy & Waste Heat Recovery: It operates advanced conventional plants, ranging from supercritical technology to waste heat recovery systems, delivering stable and efficient energy. These initiatives not only optimize operating costs but also help reduce emissions. The portfolio includes 8.9 GW of thermal energy capacity and 443 MW of waste heat recovery capacity.
- Hydro Energy: It is at the forefront of harnessing water as a sustainable source of energy and has been a pioneer in hydro power development. It has an installed hydro capacity of 2,605 MW (including 1,725 MW under construction) and is also developing 2,800 MW of pumped storage projects (PSP), which will play a crucial role in balancing renewable integration and ensuring grid stability.
- TRANSMISSION & DISTRIBUTION:- The company’s transmission and distribution business is designed to deliver reliable power seamlessly, even across difficult environment and long distances. It operates around 7,047 circuit kilo meters of transmission lines, including 2,414 ckm under construction, covering states such as Mumbai, Uttar Pradesh, West Bengal, Bihar, Rajasthan, and Haryana. On the distribution side, it serves more than 12.8 million customers in Mumbai, Delhi, Odisha, and Ajmer. To improve efficiency and transparency, it has also installed over 26 lakh smart meters, significantly improving customer experience.
- NEW-AGE ENERGY SOLUTIONS:- At Tata Power, it transforming the consumer energy landscape with the new‑age and environment-friendly energy solutions across the rooftop solar, smart meters, battery energy storage systems (BESS), electric vehicles (EV), and home automation verticals.
- Rooftop Solar:- With a strong pan-India presence, the company accelerate solar adoption by offering end-to-end sales, service, and innovative solutions, powering a greener, more sustainable future for the consumers. 1.5+ lakh Rooftop solar installations (achieving 3 GW capacity till date).
- EZ Home – A smart living solution powered by advanced technology, enabling intelligent automation and control. It helps reduce energy consumption by 8.5% and lowers electricity bills by up to 20%. During the year, 14 new products were launched under this segment.
- EZ Charge – Powering India’s EV charging ecosystem and driving the nation’s e-mobility transition. The network comprises over 6,700 public EV and bus charging points and more than 1,35,000 home chargers installed.
BUSINESS HIGHLIGHTS
- Signed a PPA with SJVN Limited to set up a 460 MW Firm and Dispatchable Renewable Energy (FDRE) project.
- Signed PPA with NTPC for the development of a 200 MW FDRE project.
- Commissioned India’s first solar plant to incorporate a unique combination of single-axis trackers and bi-facial modules of 431 MWp DC (330 MW AC) in Neemuch, Madhya Pradesh.
- Secured H 455 crore contract to supply 300 MWp ALMM Modules to Maharashtra State Power Generation Company.
- Partnered with Tata Motors to co‑develop a 131 MW wind-solar hybrid project.
- Signed MoU with Asian Development Bank for $ 4.25 billion to finance clean and green energy projects.
- Crossed 1.5 lakh rooftop solar installations, achieving 3 GW capacity across 700+ cities till date and maintaining the No.1 rooftop solar rank for 10 years.
- Partnered with Noida International Airport to supply 10.8 MW wind power.
- Won two transmission projects for 377 ckm with a capex of ~H 2,500 crore and for 384 ckm on Build-OwnOperate-Transfer (BOOT) basis with a capex of ~H 2,300 crore.
- Partnered with Bhutan’s Druk Green Power Corporation to develop 5 GW clean and green energy projects, out of this for 600 MW Khorlochhu Hydro Project, executed definitive agreements and work has begun.
- The 1,000 MW Bhivpuri Pumped Hydro Project has secured key approvals, including from the Central Electricity Authority (CEA), and is set to begin construction in H1 FY26 with commissioning targeted by August 2028. Work on the 1,800 MW Shirawata project is expected to start in later part of the year and will get commissioned in 2030.
Indian Power Sector
In FY 2024-25, India’s power sector witnessed significant progress across energy generation, transmission, and distribution sectors. Per capita electricity consumption surged to 1,395 kWh in 2023-24, reflecting a 45.8% increase (438 kWh) from 957 kWh in 2013-14. The sector demonstrated resilience by being able to reduce both monthly energy and peak demand shortages to an average of 0.09% and 0.03% in FY 2024-25. Energy requirements, grew by 4.2%, reaching 1,695 billion units (BU).
In FY24-25, Indian’s installed generation capacity stood at 475 GW as of March 31, 2025 with a capacity addition of 33 GW. And share of thermal capacities in the total installed generation capacity declined from 62% in FY20 to 52% in FY205, the share of renewable capacities grew from 245 to 36%. Approx. 86% of total capacity additions of 33 GW came from renewable sources (Solar: 24 GW and other renewables: 5 GW) in FY25. And lastly 4 GW of coal – based plants were commissioned, constituting another 11% of the additions.
India’s power demand is projected to grow significantly, driven by its rapid economic expansion, electrification of transport and expansion of data centres. It is getting exacerbated by heatwaves pushing peak electricity demand higher. At the same time, the global shift towards clean and green energy has created a dynamic opportunity landscape. This calls for a strategic balance between conventional and renewable energy sources, accelerated expansion of energy storage, transmission and power distribution infrastructure, and the incubation of innovative, future-ready energy solutions.
There is increasing traction towards firm and dispatchable modes of generation, supported by the evolution of advanced energy storage solutions. At the same time, the deployment of smart grids, AI-driven energy management, and IoT-based solutions is enhancing overall system efficiency and reliability. With urban energy demand expected to rise steadily, the need for smart infrastructure and dependable power distribution is becoming more critical. In this context, grid resilience, sustainability, and affordability will continue to remain top priorities to ensure long-term energy security.
Management Commentary on the business & its future prospects:
- Power consumption declined 1.3% this quarter due to an early monsoon. However, Tata Power expects demand to rebound in August–September with rising temperatures. Several capacity additions, initially planned for last year, have spilled over into this financial year.
- Discussions on Section-11 concluded in June. Tata Power is finalizing a Supplementary PPA (SPPA) with procurer states, expected within August. The Mundra plant is currently under maintenance, with operations to resume post-SPPA, ensuring competitiveness and optimized cost recovery.
- Operational improvements reduced AT&C losses to 17–18%, with a target of 10% in three years. Collection efficiency has improved, legacy issues are resolved, and 25 lakh smart meters installed. Strong execution supports higher profitability and predictable cash flows.
- Renewable capacity, rooftop installations, and pumped hydro projects are expected to expand substantially in FY’26–27. Tata Power is committed to supplying 24×7 clean energy to C&I customers, improving EBITDA, PAT, and operational efficiency across its generation, transmission, distribution, and renewable portfolios.
- From June 2026, all rooftop projects, including residential and C&I, will require domestic DCR-compliant cells and modules. Tata Power is already executing multiple projects under DCR guidelines, positioning itself as a leading domestic solar supplier and supporting government renewable initiatives.
- Tata Power’s cell plants were not on the initial ALMM-II approved list due to pending inspections. Once plant inspections are completed, the company will be added, ensuring compliance with government programs and continued eligibility for domestic rooftop and utility projects.
Q1FY26 Result Analysis
- Revenue from Operations: Tata Power reported revenue from operations of Rs 18,035.07 crore in Q1 FY26, representing a QoQ growth of 5.49% from Rs 17,095.88 crore in Q4 FY25 and a YoY increase of 4.3% from Rs 17,293.62 crore in Q1 FY25. The relatively muted growth was primarily due to lower power scheduling caused by an early monsoon.
- Profit After Tax: Tata power has reported a PAT of Rs 1,262.32 crore in Q1 FY26, reflecting a 3.35% decline from Rs 1,306.09 crore in Q4 FY25 on a QoQ basis, primarily due to the net movement in regulatory deferral balances. On a YoY basis, PAT increased by 6.2% compared to Rs 1,188.63 crore in Q1 FY25.
- EBITDA: TPCL has reported an EBITDA of Rs 3,565.17 crore in Q1 FY26, reflecting a YoY growth of 16.4% compared to Rs 3,061.75 crore in Q1 FY25, and a QoQ growth of 16.2% from Rs 3,068.26 crore in Q4 FY25. The EBITDA margin for Q1 FY26 improved to 19.77%, up from 17.70% YoY and 17.95% QoQ.
- Segment-wise Revenue: In Q1 FY26, Tata Power reported segment-wise revenues of Rs 4,844.19 crore from Thermal & Hydro, Rs 10,077.83 crore from Transmission and Distribution, Rs 3,625.85 crore from Renewables, and Rs 109.05 crore from other businesses.
Outlook:
TPCL, is one of India’s largest integrated power companies with operations across the power value chain – generation, transmission, distribution, and renewable energy. Operational momentum remained strong with a record 652 MW capacity addition. The company further strengthened its renewable portfolio by acquiring a 40% stake in KHPL. Reinforcing its clean mobility leadership, Tata Power inaugurated India’s largest TATA.ev MegaCharger Hub. With sustained capex, diversified operations, and a growing renewable pipeline, the company remains well positioned to support India’s energy transition and deliver long-term value. The company will commissioned two projects in this quarter, and more within 3–4 quarters, ensuring reliable infrastructure and supporting long-term performance growth.
On a TTM basis, the company has reported an EPS of Rs 12.93 and is trading at a P/E of 30.54x at the current market price of Rs 395 per share. Thus, we recommend an Accumulate rating on the stock, with a price range of Rs 380–Rs 370, and a target price of Rs 490 within an investment horizon of 12 months.
Profit and Loss Statement:
| Particulars | Q1FY26 | Q1FY25 | Q4FY25 | YoY% | QoQ% | FY25 | FY24 | YoY% |
| Net Sales | 18035.1 | 17293.6 | 17095.9 | 4.3 | 5.5 | 65478.2 | 61448.9 | 6.6 |
| Other Income | 494.4 | 577.7 | 860.9 | -14.4 | -42.6 | 2307.3 | 3367.8 | -31.5 |
| Total Income | 18529.5 | 17871.3 | 17956.8 | 3.7 | 3.2 | 67785.5 | 64816.7 | 4.6 |
| Total Expenditure | 14469.9 | 14231.9 | 14027.6 | 1.7 | 3.2 | 52646.6 | 50665.1 | 3.9 |
| EBIDT | 4059.6 | 3639.5 | 3929.2 | 11.5 | 3.3 | 15138.9 | 14151.6 | 7.0 |
| Interest | 1279.2 | 1176.2 | 1213.2 | 8.8 | 5.4 | 4702.4 | 4633.2 | 1.5 |
| EBDT | 2780.4 | 2463.2 | 2716.0 | 12.9 | 2.4 | 10436.5 | 9518.4 | 9.6 |
| Depreciation | 1160.9 | 972.9 | 1116.3 | 19.3 | 4.0 | 4116.9 | 3786.4 | 8.7 |
| EBT | 1619.5 | 1490.3 | 1599.7 | 8.7 | 1.2 | 6319.6 | 5732.0 | 10.3 |
| Tax | 144.8 | 181.5 | 189.5 | -20.2 | -23.6 | 972.1 | 808.8 | 20.2 |
| Deferred Tax | 212.3 | 120.3 | 104.1 | 76.5 | 103.9 | 572.1 | 643.1 | -11.0 |
| PAT | 1262.3 | 1188.6 | 1306.1 | 6.2 | -3.4 | 4775.4 | 4280.1 | 11.6 |
Balance Sheet:
| Particulars | 202503 | 202403 | 202303 |
| SOURCES OF FUNDS : | |||
| Share Capital | 319.6 | 319.6 | 319.6 |
| Reserves Total | 35521.1 | 32035.7 | 28467.9 |
| Total Shareholders Funds | 35840.7 | 32355.3 | 28787.4 |
| Minority Interest | 6765.4 | 5977.5 | 5416.7 |
| Secured Loans | 34435.2 | 27848.4 | 28224.9 |
| Unsecured Loans | 28430.6 | 25841.1 | 24698.1 |
| Total Debt | 62865.8 | 53689.5 | 52923.0 |
| Other Liabilities | 16292.1 | 15101.4 | 13913.6 |
| Total Liabilities | 121764.0 | 107123.7 | 101040.7 |
| APPLICATION OF FUNDS : | |||
| Gross Block | 113685.7 | 98780.6 | 89897.1 |
| Less: Accumulated Depreciation | 35205.3 | 31470.2 | 28150.4 |
| Less: Impairment of Assets | 106.0 | 100.9 | 0.0 |
| Net Block | 78374.4 | 67209.6 | 61746.7 |
| Capital Work in Progress | 12678.9 | 11561.3 | 5376.4 |
| Investments | 16316.4 | 16316.0 | 16669.7 |
| Current Assets, Loans & Advances | |||
| Inventories | 4571.8 | 4419.6 | 3942.9 |
| Sundry Debtors | 5709.8 | 7401.7 | 6952.2 |
| Cash and Bank | 11751.0 | 9151.9 | 11206.5 |
| Loans and Advances | 6566.9 | 6014.3 | 7840.4 |
| Total Current Assets | 28599.4 | 26987.5 | 29942.0 |
| Less: Current Liabilities and Provisions | |||
| Current Liabilities | 30197.5 | 29071.6 | 24859.9 |
| Provisions | 645.8 | 585.9 | 529.0 |
| Total Current Liabilities | 30843.2 | 29657.5 | 25389.0 |
| Net Current Assets | -2243.8 | -2670.0 | 4553.0 |
| Deferred Tax Assets | 5102.0 | 5602.6 | 5508.7 |
| Deferred Tax Liability | 8688.1 | 7875.8 | 7175.2 |
| Net Deferred Tax | -3586.1 | -2273.2 | -1666.5 |
| Other Assets | 20224.2 | 16980.1 | 14361.5 |
| Total Assets | 121764.0 | 107123.7 | 101040.7 |
Cash Flow Statement:
| Particulars | 202503 | 202403 | 202303 |
| Cash Flow Summary | |||
| Cash and Cash Equivalents at Beginning of the year | 3143.85 | 4072.28 | 2829.02 |
| Net Cash from Operating Activities | 12680.19 | 12504.37 | 7165.59 |
| Net Cash Used in Investing Activities | -15436.29 | -8935.37 | -7263.1 |
| Net Cash Used in Financing Activities | 4292.39 | -4497.43 | 1340.77 |
| Net Inc/(Dec) in Cash and Cash Equivalent | 1536.29 | -928.43 | 1243.26 |
| Cash and Cash Equivalents at End of the year | 4680.14 | 3143.85 | 4072.28 |
Source: Company website, EWL Research
Disclosure in pursuance of Section 19 of SEBI (RA) Regulation 2014
Elite Wealth Limited does/does not do business with companies covered in its research reports. Investors should be aware that the Elite Wealth Limited may/may not have a conflict of interest that could affect the objectivity of this report. Investors should consider this report as only information in making their investment decision and must exercise their own judgment before making any investment decision.
For analyst certification and other important disclosures, see the Disclosure Appendix, or go to www.elitewealth.in. Analysts employed by Elite Wealth Limited are registered/qualified as research analysts with SEBI in India. (SEBI Registration No.: INH100002300)
Disclosure Appendix
Analyst Certification (For Reports)
Vindhyachal Prasad, Elite Wealth Limited, vindhyachal@elitestock.com
The analyst(s) certify that all of the views expressed in this report accurately reflect my/our personal views about the subject company or companies and its or their securities. I/We also certify that no part of my compensation was, is or will be, directly or indirectly, related to the specific recommendations or views expressed in this report. Unless otherwise stated, the individuals listed on the cover page of this report are analysts in Elite Wealth Limited.
As to each individual report referenced herein, the primary research analyst(s) named within the report individually certify, with respect to each security or issuer that the analyst covered in the report, that:
- all of the views expressed in the report accurately reflect his or her personal views about any and all of the subject securities or issuers; and
- No part of any of the research analyst’s compensation was, is, or will be directly or indirectly related to the specific recommendations or views expressed in the For individual analyst certifications, please refer to the disclosure section at the end of the attached individual notes.
Research Excerpts
This note may include excerpts from previously published research. For access to the full reports, including analyst certification and important disclosures, investment thesis, valuation methodology, and risks to rating and price targets, please visit www.elitewealth.in.
Company-Specific Disclosures
Important disclosures, including price charts, are available and all Elite Wealth Limited covered companies by visiting https://www.elitewealth.in, or emailing research@elitestock.com with your request. Elite Wealth Limited may screen companies based on Strategy, Technical, and Quantitative Research. For important disclosures for these companies, please e-mail research@elitestock.com.
Options related research:
If the information contained herein regards options related research, such information is available only to persons who have received the proper option risk disclosure documents. For a copy of the risk disclosure documents, please contact your Broker’s Representative or visit the OCC’s website at https://www.elitewealth.in
Other Disclosures
All research reports made available to clients are simultaneously available on our client websites. Not all research content is redistributed, e-mailed or made available to third-party aggregators. For all research reports available on a particular stock, please contact your respective broker’s sales person.
Ownership and material conflicts of interest Disclosure
Elite Wealth Limited policy prohibits its analysts, professionals reporting to analysts from owning securities of any company in the analyst’s area of coverage. Analyst compensation: Analysts are salary based permanent employees of Elite Wealth Limited. Analyst as officer or director: Elite Wealth Limited policy prohibits its analysts, persons reporting to analysts from serving as an officer, director, board member or employee of any company in the analyst’s area of coverage.
Country Specific Disclosures
India – For private circulation only, not for sale. Legal Entities Disclosures
Mr. Ravinder Parkash Seth is the Managing Director of Elite Wealth Ltd (EWL, henceforth), having its registered office at Casa Picasso, Golf Course Extension, Near Rajesh Pilot Chowk, Radha Swami, Sector-61, Gurgaon-122001 Haryana, is a SEBI registered Research Analyst and is regulated by Securities and Exchange Board of India. Telephone: 011-43035555, Facsimile: 011-22795783 and Website: www.elitewealth.in
EWL discloses all material information about itself including its business activity, disciplinary history, the terms and conditions on which it offers research report, details of associates and such other information as is necessary to take an investment decision, including the following:
- Reports
- a) EWL or his associate or his relative has no financial interest in the subject company and the nature of such financial interest;
- EWL or its associates or relatives, have no actual/beneficial ownership of one %. or more in the securities of the subject company, at the end of the month immediately preceding the date of publication of the research report or date of the public appearance;
- EWL or its associate or his relative, has no other material conflict of interest at the time of publication of the research report or at the time of public appearance;
- Compensation
- EWL or its associates have not received any compensation from the subject company in the past twelve months;
- EWL or its associates have not managed or co-managed public offering of securities for the subject company in the past twelve months;
- EWL or its associates have not received any compensation for investment banking or merchant banking or brokerage services from the subject company in the past twelve months;
- EWL or its associates have not received any compensation for products or services other than investment banking or merchant banking or brokerage services from the subject company in the past twelve months;
- EWL or its associates have not received any compensation or other benefits from the Subject Company or third party in connection with the research
- In respect of Public Appearances
- EWL or its associates have not received any compensation from the subject company in the past twelve months;
The subject company is not now or never a client during twelve months preceding the date of distribution of the research report and the types of services provided by EWL
