
Established in 2000, HDFC Life is one of a leading long-term life insurance solutions provider in India, offering a range of individual and group insurance solutions that meet various customer needs such as Protection, Pension, Savings, Investment, Annuity and Health. The Company has over 70 products (individual and group products) including optional riders in its portfolio, catering to a diverse range of customer needs. HDFC Life continues to benefit from its increased presence across the country, having a wide reach with branches and additional distribution touch-points through several new tie-ups and partnerships. The count of distribution partnerships is over 500, comprising banks, NBFCs, MFIs, SFBs, brokers, new ecosystem partners amongst other.
| Result Analysis: HDFC Life Insurance Limited
(CMP: Rs. 756) |
Result Update: Q1FY26 |
| Stock Details | |
| Market Cap. (Cr.) | 1,62,916 |
| Equity (Cr.) | 2,153 |
| Face Value | 10 |
| 52 Wk. high/low | 821/584 |
| BSE Code | 540777 |
| NSE Code | HDFCLIFE |
| Book Value (Rs) | 72.91 |
| Sector | Life Insurance |
| Key Ratios | |
| ROCE (%): | 0.36 |
| ROE (%): | 11.12 |
| TTM EPS: | 8.73 |
| P/BV: | 10.36 |
| TTM P/E: | 86.6 |
| 13M / 61M Persistency | 86%/64% |
| Solvency Ratio | 192% |
Result Highlights:
- HDFC Life reported net premium income of Rs 14,539.42 crore for Q1 FY26, reflecting a 9% YoY increase from Rs 12,548.42 crore in Q1 FY25. However, the figure represents a 39% sequential decline compared to Rs 23,842.99 crore in Q4FY25, in line with typical seasonality trends in the life insurance industry. The YoY growth was primarily supported by a 12.5% increase in Individual APE, indicating robust underlying business momentum.
- The company reported a Profit After Tax (PAT) of Rs 548.35 crore for Q1 FY26, reflecting a 5% YoY increase from Rs 478.97 crore in Q1 FY25. On a sequential basis, PAT also grew by 15.4%, up from Rs 475.36 crore in Q4 FY25, driven by strong back-book profitability and disciplined cost management.
- In Q1 FY26, HDFC Life reported a 12.5% YoY growth in both Individual APE at Rs 2,777 crore and Total APE at Rs 3,225 crore, reflecting strong new business momentum. This performance highlights sustained customer acquisition strength and effective distribution execution, despite a challenging macroeconomic environment.
- HDFC Life outperformed both the overall industry and the private sector in Q1FY26, leading to a 70 basis point increase in its overall market share to 12.1%, marking a new milestone for the company. Within the private sector, it gained 40 basis points, taking its market share to 5%.
- In Q1 FY26, HDFC Life’s Value of New Business (VNB) rose to Rs 809 crore from Rs 718 crore in Q1 FY25, marking a 12.7% YoY growth, while new business margins improved slightly to 25.1% from 25.0%, reflecting a balanced product mix, strong sales execution, and operational efficiency despite regulatory changes and ongoing investments.
- Assets Under Management (AUM) stood at Rs 3,55,897 crore as of June 30, 2025, reflecting a 15% YoY growth, up from Rs 3,10,240 crore in Q1 FY25. On a YoY basis, AUM increased by 8% from Rs 3,36,282 crore as of March 31, 2025, indicating continued momentum and consistent expansion in the company’s investment base.
- Persistency metrics remained healthy, with 13th and 61st month persistency at 86% and 64% respectively. 61st month persistency improved across cohorts, supported by stronger retention in long-term savings products.
- HDFC Life’s solvency ratio improved to 192% in Q1 FY26 from 186% in Q1 FY25, reflecting strong capital adequacy, prudent risk management, and sufficient buffer over regulatory requirements, ensuring stability to support growth and meet policyholder obligations.
Financial Performance:
Shareholding Pattern:
| Particulars (In %) | Q4FY25 | Q4FY24 |
| Promoter | 50.32 | 50.37 |
| FIIs | 25.26 | 30.37 |
| DIIs | 14.10 | 7.94 |
| Public and Other | 10.32 | 11.33 |
Management Commentary:
- Despite a 16% shift from non-par to par products, margins remained stable at 25.1%, aided by improved product-level profitability, rider attachments, and better protection-linked ULIP sales, offsetting regulatory surrender charge impacts and fixed cost absorption.
- The company has announced a final dividend of Rs. 2.10 per share.
- For FY26, the company expects muted growth in H1 due to a high base and macro uncertainties, with momentum picking up in H2. Margins are expected to remain range-bound between 25% and 27%, supported by an improving product mix, digital initiatives, and industry outperformance.
Outlook:
HDFC Life expects muted growth in H1 FY26 due to a high base effect and ongoing macroeconomic uncertainties but anticipates improved momentum in H2, supported by a robust product mix, digital integration, and sustained distribution strength. The company aims to maintain its VNB margins in the 25–27% range for FY26, driven by balanced product profitability, enhanced protection and rider attachment, and better cost absorption. The company reported an EPS of Rs 2.54 in Q1FY26 and TTM EPS of Rs 8.73 and currently trades at a TTM P/E of 86.6x and P/B of 10.36x.
Results:
| Particulars | Q1FY26 | Q1FY25 | Q4FY25 | YoY% | QoQ% | FY25 | FY24 | YoY% |
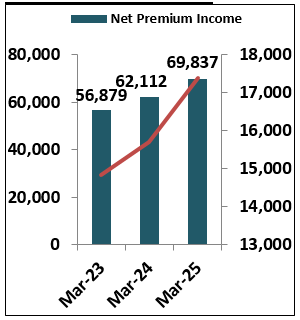
| Operating Income | 14539.42 | 12548.42 | 23842.99 | 15.9 | -39.0 | 69836.97 | 62112.05 | 12.4 |
| Other Operating Income | 14923.76 | 14385.43 | 347.66 | 3.7 | 4192.6 | 27084.77 | 39369.75 | -31.2 |
| Other Income | 164.48 | 89.64 | 123.56 | 83.5 | 33.1 | 463.36 | 539.47 | -14.1 |
| Total Income | 29627.66 | 27023.49 | 24314.21 | 9.6 | 21.9 | 97385.1 | 102021.27 | -4.5 |
| Operating Expenditure | ||||||||
| Employee Expenses | 880.47 | 697.88 | 866.19 | 26.2 | 1.6 | 3213.39 | 3267.07 | -1.6 |
| Selling & Administrative Expenses | 126.69 | 108.47 | 138.83 | 16.8 | -8.7 | 489.2 | 2181.99 | -77.6 |
| Other Expenses | 28023.1 | 25812.97 | 22768.01 | 8.6 | 23.1 | 92297.85 | 95684.06 | -3.5 |
| TOTAL OPERATING EXPENDITURE | 29030.26 | 26619.32 | 23773.03 | 9.1 | 22.1 | 96000.44 | 101133.12 | -5.1 |
| Operating Profit Before Prov. & Cont. | 597.4 | 404.17 | 541.18 | 47.8 | 10.4 | 1384.66 | 888.15 | 55.9 |
| Provisions & Write Offs | -6.4 | 3.39 | 40.75 | -288.8 | -115.7 | 94.92 | -89.13 | 206.5 |
| TOTAL EXPENDITURE | 29023.86 | 26622.71 | 23813.78 | 9 | 21.9 | 96095.36 | 101043.99 | -4.9 |
| EBT | 603.8 | 400.78 | 500.43 | 50.7 | 20.7 | 1289.74 | 977.28 | 32 |
| Tax | 55.45 | -78.19 | 25.07 | 170.9 | 121.2 | -521.08 | -596.8 | 12.7 |
| PAT | 548.35 | 478.97 | 475.36 | 14.5 | 15.4 | 1810.82 | 1574.08 | 15 |
Source: Company website, EWL Research
Disclosure in pursuance of Section 19 of SEBI (RA) Regulation 2014
Elite Wealth Limited does/does not do business with companies covered in its research reports. Investors should be aware that the Elite Wealth Limited may/may not have a conflict of interest that could affect the objectivity of this report. Investors should consider this report as only information in making their investment decision and must exercise their own judgment before making any investment decision.
For analyst certification and other important disclosures, see the Disclosure Appendix, or go to www.elitewealth.in. Analysts employed by Elite Wealth Limited are registered/qualified as research analysts with SEBI in India.( SEBI Registration No.: INH100002300)
Disclosure Appendix
Analyst Certification (For Reports)
Vindhyachal Prasad, Elite Wealth Limited, vindhyachal@elitestock.com
The analyst(s) certify that all of the views expressed in this report accurately reflect my/our personal views about the subject company or companies and its or their securities. I/We also certify that no part of my compensation was, is or will be, directly or indirectly, related to the specific recommendations or views expressed in this report. Unless otherwise stated, the individuals listed on the cover page of this report are analysts in Elite Wealth Limited.
As to each individual report referenced herein, the primary research analyst(s) named within the report individually certify, with respect to each security or issuer that the analyst covered in the report, that:
- all of the views expressed in the report accurately reflect his or her personal views about any and all of the subject securities or issuers; and
- no part of any of the research analyst’s compensation was, is, or will be directly or indirectly related to the specific recommendations or views expressed in the For individual analyst certifications, please refer to the disclosure section at the end of the attached individual notes.
Research Excerpts
This note may include excerpts from previously published research. For access to the full reports, including analyst certification and important disclosures, investment thesis, valuation methodology, and risks to rating and price targets, please visit www.elitewealth.in.
Company-Specific Disclosures
Important disclosures, including price charts, are available and all Elite Wealth Limited covered companies by visiting https://www.elitewealth.in, or emailing research@elitestock.com with your request. Elite Wealth Limited may screen companies based on Strategy, Technical, and Quantitative Research. For important disclosures for these companies, please e-mail research@elitestock.com.
Options related research:
If the information contained herein regards options related research, such information is available only to persons who have received the proper option risk disclosure documents. For a copy of the risk disclosure documents, please contact your Broker’s Representative or visit the OCC’s website at https://www.elitewealth.in
Other Disclosures
All research reports made available to clients are simultaneously available on our client websites. Not all research content is redistributed, e-mailed or made available to third-party aggregators. For all research reports available on a particular stock, please contact your respective broker’s sales person.
Ownership and material conflicts of interest Disclosure
Elite Wealth Limited policy prohibits its analysts, professionals reporting to analysts from owning securities of an y company in the analyst’s area of coverage. Analyst compensation: Analysts are salary based permanent employees of Elite Wealth Limited. Analyst as officer or director: Elite Wealth Limited policy prohibits its analysts, persons reporting to analysts from serving as an officer, director, board member or employee of any company in the analyst’s area of coverage.
Country Specific Disclosures
India – For private circulation only, not for sale. Legal Entities Disclosures
Mr. Ravinder Parkash Seth is the Managing Director of Elite Wealth Ltd (EWL, henceforth), having its registered office at Casa Picasso, Golf Course Extension, Near Rajesh Pilot Chowk, Radha Swami, Sector-61, Gurgaon-122001 Haryana, is a SEBI registered Research Analyst and is regulated by Securities and Exchange Board of India. Telephone: 011-43035555, Facsimile: 011-22795783 and Website: www.elitewealth.in
EWL discloses all material information about itself including its business activity, disciplinary history, the terms and conditions on which it offers research report, details of associates and such other information as is necessary to take an investment decision, including the following:
- Reports
- a) EWL or his associate or his relative has no financial interest in the subject company and the nature of such financial interest;
- EWL or its associates or relatives, have no actual/beneficial ownership of one %. or more in the securities of the subject company, at the end of the month immediately preceding the date of publication of the research report or date of the public appearance;
- EWL or its associate or his relative, has no other material conflict of interest at the time of publication of the research report or at the time of public appearance;
- Compensation
- EWL or its associates have not received any compensation from the subject company in the past twelve months;
- EWL or its associates have not managed or co-managed public offering of securities for the subject company in the past twelve months;
- EWL or its associates have not received any compensation for investment banking or merchant banking or brokerage services from the subject company in the past twelve months;
- EWL or its associates have not received any compensation for products or services other than investment banking or merchant banking or brokerage services from the subject company in the past twelve months;
- EWL or its associates have not received any compensation or other benefits from the Subject Company or third party in connection with the research 3 In respect of Public Appearances
- EWL or its associates have not received any compensation from the subject company in the past twelve months;
- The subject company is not now or never a client during twelve months preceding the date of distribution of the research report and the types of services provided by EWL


