
Mahindra & Mahindra Limited (M&M) is the flagship company of the Mahindra Group. The Company produces SUVs, Multi utility vehicles, pickups, lightweight commercial vehicles, heavyweight commercial vehicles and tractors. Its manufacturing facilities are located at Kandivali, Nashik, Igatpuri, Nagpur, Chakan, Zaheerabad, Jaipur, Rudrapur, Haridwar, Mohali and Pithampur.
| Result Analysis: Mahindra & Mahindra Limited (M&M)
(CMP: Rs. 3,066 ) |
Result Update: Q4FY25 |
| Stock Details | |
| Market Cap. (Cr.) | 3,81,316 |
| Equity (Cr.) | 558 |
| Face Value | 5 |
| 52 Wk. high/low | 3,276/2,159 |
| BSE Code | 500520 |
| NSE Code | M&M |
| Book Value (Rs) | 620.03 |
| Sector | Automobile |
| Key Ratios | |
| ROCE (%): | 14.21 |
| ROE (%): | 16.78 |
| EPS: | 115.06 |
| P/BV: | 4.94 |
| P/E: | 26.64 |
| D/E | 0.07 |
Result Highlights:
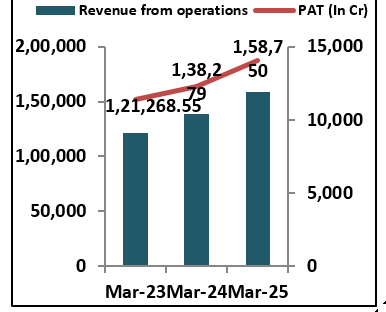
- The company has reported revenue from operations of Rs 42585.67 cr in Q4FY25 up 20.4% from Rs 35373.34 cr in Q4FY24 on YoY basis and up 2.7% from Rs 41464.98 cr in Q3FY25 on QoQ basis.
- It has reported EBIDTA for the Q4FY25 of Rs 7910.94 cr increased with the growth rate of 19.8% from Rs 6603.91 cr in Q4FY24 on YoY basis and but declined 3.88% from Rs 8230.73 cr in Q3FY25 on QoQ basis.
- It has posted PAT in Q4FY25 of Rs 3541.85 cr growth of 13.3% from Rs 3124.94 cr in Q4FY24 on YoY basis and decreased with 2.3% from Rs 3624.48 cr in Q3FY25 on QoQ basis.
- In FY25, Auto and Farm maintain market leadership in key segments with 15% revenue growth with profits up 17%. Financial services AUM grew at 17%.
- In Q4, the automotive segment reported 253,000 units in volume (including LMM & MEAL), reflecting 18% growth, with UVs contributing 149,000 units (+18% YoY); revenue market share improved by 310 bps to 23.5%.
- In Q4, the Farm segment achieved volumes of 87,000 units, up 23% YoY, with Q4 market share at 41.2% and full-year FY25 market share rising by 170 bps to 43.3%.
- Mahindra Electric Origin SUVs created History with New EV record of 30,179 bookings on day 1.
Financial Performance:
Shareholding Pattern:
| Particulars (In %) | Q4FY25 | Q4FY24 |
| Promoter | 18.14 | 18.15 |
| FIIs | 39.92 | 43.72 |
| DIIs | 29.29 | 25.50 |
| Public and Other | 12.59 | 12.58 |
| Government | 0.07 | 0.07 |
Management Commentary:
- To support future growth, capacity for XUV3XO and Thar Roxx will be increased by 3,000 units in FY26; a new platform capacity of 1.2 lakh units per annum is being set up at Chakan, and plans are underway for a new Greenfield plant targeting FY28 and beyond.
- The company has announced Dividend of Rs 25.3 per share.
- The company aims to scale its IO revenue 2.5 times by FY26, focusing on high-growth businesses and strategic initiatives to accelerate value creation and strengthen its future-ready portfolio.
Outlook:
Mahindra & Mahindra is poised for robust growth, backed by strong performance in both Auto and Farm segments, sustained market leadership, and solid financials. With a 20% YoY revenue increase and strategic capacity expansions underway, the company is well-positioned to meet rising demand. Aggressive targets like scaling IO revenue 2.5x by FY26 and launching a greenfield plant by FY28 reflect a future-focused approach. The record EV bookings signal strong consumer interest, supporting M&M’s electrification push. Coupled with steady growth in financial services and a generous dividend, M&M is aligning operational excellence with long-term value creation and global expansion ambitions.. It has posted an EPS of ₹115.06 in FY25, and the stock is currently trading at a P/E of 26.64x and P/B of 4.94x.
Results:
| Particulars (In Rs. Cr.) | Q4FY25 | Q4FY24 | Q3FY25 | YoY% | QoQ% | FY25 | FY24 | YoY% |
| Sales | 42585.67 | 35373.34 | 41464.98 | 20.4 | 2.7 | 158749.75 | 138279.3 | 14.8 |
| Other Operating Income | 13.64 | 78.39 | 5.07 | -82.6 | 169.0 | 461.07 | 798.97 | -42.3 |
| Other Income | 1141.1 | 750.44 | 718.59 | 52.1 | 58.8 | 3718.47 | 3297.85 | 12.8 |
| Total Income | 43740.41 | 36202.17 | 42188.64 | 20.8 | 3.7 | 162929.3 | 142376.13 | 14.4 |
| Total Expenditure | 34688.37 | 28847.82 | 33239.32 | 20.2 | 4.4 | 128692.63 | 114186.34 | 12.7 |
| EBIDT | 9052.04 | 7354.35 | 8949.32 | 23.1 | 1.1 | 34236.66 | 28189.78 | 21.5 |
| Interest | 2396.52 | 1989.3 | 2362.16 | 20.5 | 1.5 | 9083.39 | 7488.21 | 21.3 |
| EBDT | 6655.52 | 5365.05 | 6587.16 | 24.1 | 1.0 | 25153.27 | 20701.57 | 21.5 |
| Depreciation | 2028.72 | 1335.05 | 1495.17 | 52 | 35.7 | 6073.65 | 4723.78 | 28.6 |
| EBT | 4626.8 | 4030 | 5091.99 | 14.8 | -9.1 | 19079.62 | 15977.79 | 19.4 |
| Tax | 1205.47 | 905.91 | 1350.06 | 33.1 | -10.7 | 4851.93 | 3597.39 | 34.9 |
| Deferred Tax | -120.52 | -0.85 | 117.45 | -14078.8 | -202.6 | 154.52 | 110.58 | 39.7 |
| PAT | 3541.85 | 3124.94 | 3624.48 | 13.3 | -2.3 | 14073.17 | 12269.82 | 14.7 |
Segmental Revenue:
| Particulars (In Rs. Cr.) | Q4FY25 | Q4FY24 | Q3FY25 | YoY% | QoQ% | FY25 | FY24 | YoY% |
| Automotive | 25902.39 | 20907.66 | 23390.69 | 23.9 | 10.7 | 90824.58 | 76155.98 | 19.3 |
| Farm Equipment | 7933.25 | 6790.4 | 9536.94 | 16.8 | -16.8 | 35375.3 | 33474.15 | 5.7 |
| Financial Services | 4827.12 | 4235.25 | 4759.65 | 14.0 | 1.4 | 18295.83 | 15652.02 | 16.9 |
| Industrial Businesses and Consumer Services | 5087.2 | 4619.72 | 4847.23 | 10.1 | 5.0 | 18971.43 | 17719.1 | 7.1 |
Outlook:
Netweb Technologies is well-positioned to benefit from India’s growing focus on AI and digital infrastructure, supported by strong government initiatives. With a 55.9% YoY revenue growth and 112% growth in AI systems income in FY25, the company is demonstrating robust momentum. Its strategic focus on HPC, Private Cloud, and AI Systems, along with the launch of Skylus.ai, enhances its role in shaping India’s AI future. The successful SAP deployment and PLI Scheme 2.0 benefits further strengthen operational and financial performance. A strong order book of ₹325.2 crore and a ₹2.5 per share dividend reflect confidence in sustained growth and shareholder value creation. It has posted an EPS of ₹20.24x in FY25. The stock currently trading at a P/E of 79.2x and P/B of 19.92x.
Results:
| Particulars (In Rs. Cr.) | Q4FY25 | Q4FY24 | Q3FY25 | YoY% | QoQ% | FY25 | FY24 | YoY% |
| Sales | 414.65 | 265.89 | 333.99 | 55.9 | 24.2 | 1149.02 | 724.08 | 58.7 |
| Other Income | 2.5 | 3.94 | 1.56 | -36.5 | 60.3 | 9.39 | 11.89 | -21 |
| Total Income | 417.15 | 269.83 | 335.55 | 54.6 | 24.3 | 1158.41 | 735.96 | 57.4 |
| Total Expenditure | 354.89 | 225.47 | 290.05 | 57.4 | 22.4 | 989.01 | 621.55 | 59.1 |
| EBIDT | 62.26 | 44.36 | 45.5 | 40.4 | 36.8 | 169.4 | 114.42 | 48.1 |
| Interest | 1.19 | 2.83 | 1.47 | -58 | -19.0 | 4.09 | 6.21 | -34.1 |
| EBDT | 61.08 | 41.53 | 44.02 | 47.1 | 38.8 | 165.31 | 108.21 | 52.8 |
| Depreciation | 3.18 | 1.73 | 3.1 | 83.8 | 2.6 | 11.34 | 6.25 | 81.4 |
| EBT | 57.9 | 39.8 | 40.92 | 45.5 | 41.5 | 153.97 | 101.96 | 51 |
| Tax | 15.08 | 9.54 | 10.87 | 58.1 | 38.7 | 40.21 | 25.72 | 56.3 |
| Deferred Tax | -0.17 | 0.61 | -0.27 | -127.9 | -37.0 | -0.71 | 0.34 | -308.8 |
| PAT | 42.99 | 29.66 | 30.32 | 44.9 | 41.8 | 114.48 | 75.9 | 50.8 |
Source: Company website, EWL Research
Disclosure in pursuance of Section 19 of SEBI (RA) Regulation 2014
Elite Wealth Limited does/does not do business with companies covered in its research reports. Investors should be aware that the Elite Wealth Limited may/may not have a conflict of interest that could affect the objectivity of this report. Investors should consider this report as only information in making their investment decision and must exercise their own judgment before making any investment decision.
For analyst certification and other important disclosures, see the Disclosure Appendix, or go to www.elitewealth.in. Analysts employed by Elite Wealth Limited are registered/qualified as research analysts with SEBI in India.( SEBI Registration No.: INH100002300)
Disclosure Appendix
Analyst Certification (For Reports)
Vindhyachal Prasad, Elite Wealth Limited, vindhyachal@elitestock.com
The analyst(s) certify that all of the views expressed in this report accurately reflect my/our personal views about the subject company or companies and its or their securities. I/We also certify that no part of my compensation was, is or will be, directly or indirectly, related to the specific recommendations or views expressed in this report. Unless otherwise stated, the individuals listed on the cover page of this report are analysts in Elite Wealth Limited.
As to each individual report referenced herein, the primary research analyst(s) named within the report individually certify, with respect to each security or issuer that the analyst covered in the report, that:
- all of the views expressed in the report accurately reflect his or her personal views about any and all of the subject securities or issuers; and
- no part of any of the research analyst’s compensation was, is, or will be directly or indirectly related to the specific recommendations or views expressed in the For individual analyst certifications, please refer to the disclosure section at the end of the attached individual notes.
Research Excerpts
This note may include excerpts from previously published research. For access to the full reports, including analyst certification and important disclosures, investment thesis, valuation methodology, and risks to rating and price targets, please visit www.elitewealth.in.
Company-Specific Disclosures
Important disclosures, including price charts, are available and all Elite Wealth Limited covered companies by visiting https://www.elitewealth.in, or emailing research@elitestock.com with your request. Elite Wealth Limited may screen companies based on Strategy, Technical, and Quantitative Research. For important disclosures for these companies, please e-mail research@elitestock.com.
Options related research:
If the information contained herein regards options related research, such information is available only to persons who have received the proper option risk disclosure documents. For a copy of the risk disclosure documents, please contact your Broker’s Representative or visit the OCC’s website at https://www.elitewealth.in
Other Disclosures
All research reports made available to clients are simultaneously available on our client websites. Not all research content is redistributed, e-mailed or made available to third-party aggregators. For all research reports available on a particular stock, please contact your respective broker’s sales person.
Ownership and material conflicts of interest Disclosure
Elite Wealth Limited policy prohibits its analysts, professionals reporting to analysts from owning securities of an y company in the analyst’s area of coverage. Analyst compensation: Analysts are salary based permanent employees of Elite Wealth Limited. Analyst as officer or director: Elite Wealth Limited policy prohibits its analysts, persons reporting to analysts from serving as an officer, director, board member or employee of any company in the analyst’s area of coverage.
Country Specific Disclosures
India – For private circulation only, not for sale. Legal Entities Disclosures
Mr. Ravinder Parkash Seth is the Managing Director of Elite Wealth Ltd (EWL, henceforth), having its registered office at Casa Picasso, Golf Course Extension, Near Rajesh Pilot Chowk, Radha Swami, Sector-61, Gurgaon-122001 Haryana, is a SEBI registered Research Analyst and is regulated by Securities and Exchange Board of India. Telephone: 011-43035555, Facsimile: 011-22795783 and Website: www.elitewealth.in
EWL discloses all material information about itself including its business activity, disciplinary history, the terms and conditions on which it offers research report, details of associates and such other information as is necessary to take an investment decision, including the following:
- Reports
- a) EWL or his associate or his relative has no financial interest in the subject company and the nature of such financial interest;
- EWL or its associates or relatives, have no actual/beneficial ownership of one %. or more in the securities of the subject company, at the end of the month immediately preceding the date of publication of the research report or date of the public appearance;
- EWL or its associate or his relative, has no other material conflict of interest at the time of publication of the research report or at the time of public appearance;
- Compensation
- EWL or its associates have not received any compensation from the subject company in the past twelve months;
- EWL or its associates have not managed or co-managed public offering of securities for the subject company in the past twelve months;
- EWL or its associates have not received any compensation for investment banking or merchant banking or brokerage services from the subject company in the past twelve months;
- EWL or its associates have not received any compensation for products or services other than investment banking or merchant banking or brokerage services from the subject company in the past twelve months;
- EWL or its associates have not received any compensation or other benefits from the Subject Company or third party in connection with the research 3 In respect of Public Appearances
- EWL or its associates have not received any compensation from the subject company in the past twelve months;
- The subject company is not now or never a client during twelve months preceding the date of distribution of the research report and the types of services provided by EWL


