
| Recommendation | CMP | Target Price | Time Horizon |
| Accumulate | Rs. 560.50 | Rs. 746 | 9-12 Months |
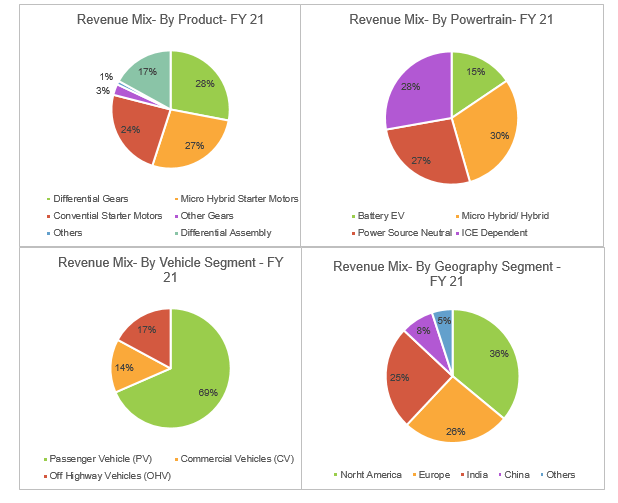
Sona Blw Precision Forgings Ltd. is a automotive technology company based in Insia. The Company is engaged in designing, manufacturing and supplying engineered automotive systems and components. The company offers products, including differential assembles differential gears, conventional and micro hybrid starter motors, belt starter generator (BSG) systems, electric traction motors and motor control units. The company offers products to automotive original equipment manufacturers (OEM) across USA (36.1%), Europe (26.5%), India (25%) and China (7.6%) for both electrified and non-electrified powertrain segments.
Stock Details |
|
| Market Cap. (Cr.) | 33510 |
| Face Value | 10.00 |
| Equity (Cr.) | 583.29 |
| 52 Wk. high/low | 610.00/295.15 |
| BSE Code | 543300 |
| NSE Code | SONACOMS |
| Book Value (Rs) | 27.50 |
| Industry | Auto Ancillaries |
| P/E | 236.42 |
Share Holding Pattern % |
|
Promoter |
67.30 |
| FIIs | 13.98 |
| Institutions | 15.37 |
| Non Promoter Corp. | 0.12 |
| Public & Others
Government |
3.45
0.00 |
| Total | 100.00 |
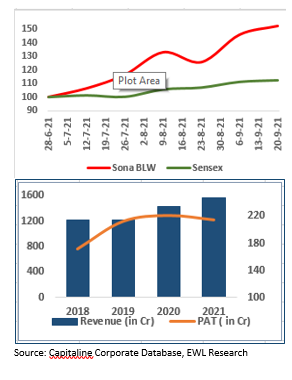
Price Chart
Key Investment Rationale:
-
Well Positioned To Capitalize On EV Opportunities: Company has diversified product basket, comprising all types of electrified powertrains and have 12.5% market share in the electric differential electric assembly market in the world.
-
Strong Order Book: Company has an order book of Rs 14,000 crore (9 times FY21 revenue) for the next 10 years, of which 57% are for EVs. The strong order book gives earnings visibility.
-
Growing Global Market Share: Sona Comstar is one of the two largest exporters of starter motors from India to global OEMs and amongst the top 10 globally. Company has a 6%/12.5%/4.6% global market share in differential gears/BEV differential assemblies/Starter Motor respectively.
-
Strong R&D focus to sustain competitive moat: Sona Comstar has a strong R&D focus, with 6% of revenue invested in R&D (FY21). About 15% of its staff is engaged in R&D. Most of the development is targeted towards embedded software, critical for EVs and proprietary gear design software for driveline systems, which should help sustain its competitive advantage.
-
Strong Clientele: On the back of superior technology know-how and good quality products, the company has partnered with Jaguar & Land Rover, Daimler, John Deere, Renault Nissan, Volvo Cars, Jing-Jin Electric, Escorts, Mahindra & Mahindra, Eicher, Ashok Leyland, Mahindra Electric, Ampere Vehicles and Maruti Suzuki, etc.
-
Market Outlook: As per Ricardo estimates, the global BEV market is expected to grow at 36% CAGR over CY20-25E & differential assembly market in EV will likely grow by 3X over FY2021-25E, which will propel Sona Comstar’s differential assembly exports to increase by 7.7X during this period. Company also manufactures starter motors for ICE/hybrid vehicles, which will benefit from market share gains and faster growth of hybrid vehicles in Europe.
Source: CRISIL, Ricardo Report, EWL Research,Company
Key Business Areas:
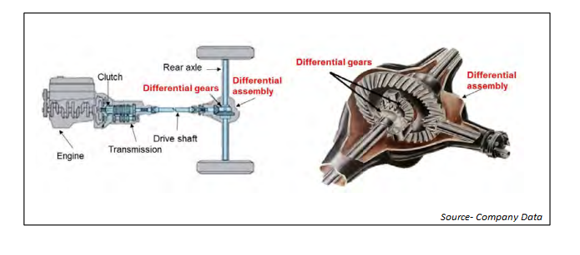
Differential assembly:
-
A differential assembly plays an integral role in how a vehicle turns. It is designed to drive a pair of wheels while allowing them to rotate at different speeds. This function provides proportional RPMs between the left and right wheels. For example, when a vehicle goes around a corner, the wheel on the outside must travel faster than the wheel on the inside. The differential distributes equal amounts of torque to both wheels. This permits the wheels to react to resistance, or provide traction, to give the wheel more resistance to rotate less. The wheel with less resistance rotates faster.
-
The company’s market share in differential assemblies was 12.5% in Q1FY2021 globally.
-
The global differential assembly market size in 2020 is estimated to be 96m units for PVs, 4m units for CVs and 1.9m units for tractors. The same is expected to grow by ~6% and 4% CAGR for PVs and tractors during 2020-25.
Differential gears:
-
Differential gears are mounted on the rear and/or front axle, depending on the power transmission system design. For example, in the case of two-wheel rear-axle-drive cars, one differential gear assembly is installed on the rear axle and vice versa. In the case of four-wheel drive cars, two differential gear assemblies are installed. On the similar principal differential gears find applications in commercial vehicle, tractors and construction equipment.
-
The company’s market share in differential gears is 6% in Q1FY2021 globally.
-
According to the CRISIL Research, the differential gears market in India is expected to expand at a CAGR of 8.5–9.5% to 33-35 mn units by FY2026E. The market is likely to increase to Rs 45000 Crore by FY2026E.
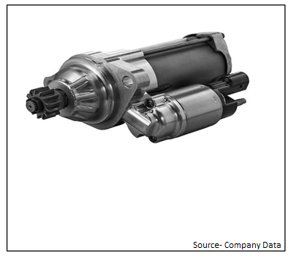
Conventional/ micro-hybrid starter Motors:
-
The company designs, develop and manufacture various series of four and six poles starter motors. Some of the key features include compact and light weighting design ranging resulting in high power output. Starter motors are required for ignition of ICE or mild hybrid vehicles
-
A traditional ICE vehicle or an ICE vehicle with a start-stop feature will require a 12 volt starter motor in-order to crank the ICE. A mild hybrid, will require a 12 volt starter motor. Full hybrids will continue to need a 12V starter motor to crank the ICE. Given there is no ICE engine in BEVs, the need for a 12V starter motor is eliminated.
-
The company’s market share in Conventional/ micro-hybrid starter Motors is 4.6% in Q1FY2021 globally.
-
According to the Ricardo report, the starter motors market is expected to grow by approximately 3% CAGR during CY2020-2025E.
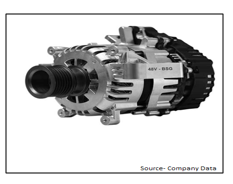
Belt-Driven Starter Generator (BSG):
-
The company has developed 48V BSG (P0 configuration), which is a hybridization solution for hybrid PVs and LCVs. It has successfully completed vehicle level demonstration of 48BSG for hybrid PVs to selected OEMs and is currently undergoing rigorous testing in compliance with international standards.
-
48V BSG have functions such as advanced stop-start, coasting and electric boost could save up to 10% of CO2 emissions.
Other Gears:
-
The company designs, develop and manufacture gearbox gears, other bevel gears such as portal axle bevel gears, farm implement gears and rotavator gears and different variants of cylindrical gears such as, reverse idler gear, spur gears and mono-block gears.
Key Strategic Alliance & Partnership:
In July 2021, SONACOMS collaborated with IRP Nexus Group, Israel for developing the Magnet-less Motors. This project is about creating an innovative motor-plus-controller combination that does not use rare earth elements like neodymium, besides offering high efficiency and low cost to manufacturers of electric two- and three-wheelers. While there are several motor manufacturers in India, they still need to import the magnets. Also, the fast growing global EV market is looking to diversify supply chains and mitigate risk stemming from dependency on limited and unreliable sources. The product is targeted to 2W/3E EVs for global markets and SONACOMS will have the exclusive rights to manufacture the system in India. It would help in supply security as 95% of the world’s rare earth metals and 75% of neodymium magnets come from China. It would also help in cost reduction as Neodymium magnets constitute 25% of total material cost and price fluctuate abnormally due to dynamic geographic situations.
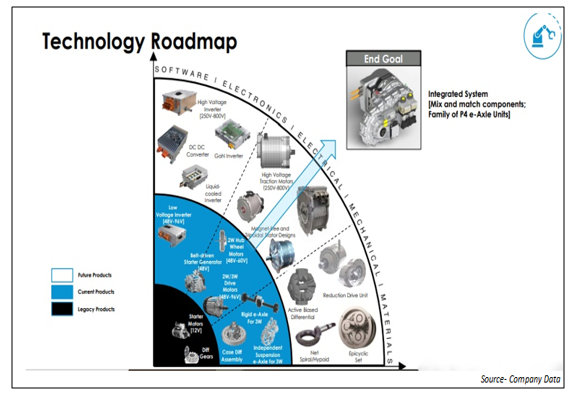
Current & Future Projects:
Industry Overview:
The Indian auto-components industry has experienced healthy growth over the last few years. The auto-components industry expanded by a CAGR of 6% over FY16 to FY20 to reach US$ 49.3 billion in FY20, up from US$ 39.05 billion in FY16 and is expected to reach US$ 200 billion by FY26. Export of auto components grew at a CAGR of 7.6% to reach Rs. 102,623 crore (US$ 14.5 billion) during the same time. As per Automobile Component Manufacturers Association (ACMA), automobile components export from India is expected to reach US$ 80 billion by 2026. The Indian auto components industry is expected to reach US$ 200 billion in revenue by 2026. Due to high development prospects in all segments of the vehicle industry, the auto component sector is expected to rise by double digits in FY22. Auto-components industry account for 2.3% of India’s Gross Domestic Product (GDP) and employs as many as 1.5 million people directly and indirectly. A stable government framework, increased purchasing power, large domestic market, and an ever-increasing development in infrastructure have made India a favorable destination for investment.
Electrification – The biggest emerging trend Electrification is clearly emerging as the biggest trend in the automobile industry. Driven by stringent emission and fuel economy (CAFE) regulations across the globe, pure ICE vehicles will no longer be a viable propulsion choice for passenger vehicles. Hence, pure ICE will continue to decline. Ricardo expects the share of pure ICE vehicles in CY 2025 to be approximately 18% of the total global production. Depending of the severity of CAFE norms across the regions, OEMs have a choice of micro (12V start-stop), mild/full hybrids, BEVs (Battery Electric Vehicles) and FCEVs (Fuel Cell Electric Vehicles) to meet corporate average fuel economy.
Investments:
The Foreign Direct Investment (FDI) inflow into Indian automotive industry during the period April 2000-March 2021 stood at US$ 25.85 billion as per the data released by Department for Promotion of Industry and Internal Trade (DPIIT).
Some of the recent investments made/planned in the Indian auto components sector is as follows:
-
The Indian government has outlined INR 42,500 Crore for the automobile and auto components sector in production-linked incentive schemes under the Department of Heavy Industries.
-
In March 2021, the government announced to offer fresh incentives to companies making electric vehicles (EVs) as part of a broad auto sector scheme. The scheme is expected to attract US$ 14 billion of investment in the next five years.
-
A cumulative investment of Rs 1, 25,000 crore (US$ 180 billion) in vehicle production and charging infrastructure would be required until 2030 to meet India’s electric vehicle (EV) ambitions. This is likely to boost the demand of auto components from local manufacturers.
Q1 FY22 Financial Performance – Consolidated
| (Amounts in Cr) | |||||
| Particulars | Q1 FY2022 | Q4FY2021 | Q1 FY2021 | Var.QoQ (%) | Var.YoY (%) |
| Revenue From Operations | 500.70 | 539.30 | 153.36 | -7.16% | 226.49% |
| Expenses | |||||
| Cost of material Consumed | 228.90 | 238.70 | 32.63 | ||
| Change In Inventories | -11.6 | -7.5 | 33.55 | ||
| Employee Benefits Expenses | 43.04 | 45.89 | 25.26 | ||
| Other Expenses | 101.63 | 122.12 | 32.71 | ||
| Total Operating Expenses | 361.97 | 399.21 | 124.15 | ||
| Operating Profit (EBITDA) | 138.73 | 140.09 | 29.21 | -0.97% | 374.94% |
| EBITDA Margin (%) | 27.71% | 25.98% | 19.05% | ||
| Other Income | 0.16 | 0.27 | 1.58 | ||
| Depreciation And Amortization Expenses | 33.38 | 28.07 | 21.80 | ||
| Profit before Interest and Taxes (EBIT) | 105.51 | 112.29 | 8.99 | -6.04% | 1073.64% |
| EBIT Margin (%) | 21.07% | 20.82% | 5.86% | ||
| Finance Costs | 8.61 | 9.43 | 7.94 | ||
| Profit before exceptional item and tax | 96.90 | 102.86 | 1.05 | ||
| Exceptional Items | -13.27 | 13.9 | |||
| Profit Before Tax (PBT) | 110.17 | 88.96 | 1.05 | ||
| Tax paid during the year | 27.69 | 29.24 | 1.08 | ||
| Profit for the year (PAT) | 82.48 | 59.72 | (0.03) | n/a | n/a |
| PAT Margin (%) | 16.5% | 11.1% | 0.0% | ||
Highlights from Con Call – Q1 FY 2022:
-
Company has increased its global market share in Differential Gears/ Starter Motors/ BEV differential assemblies from 4.5%/2.5%/8.7% in FY21 to 6.0%/4.6%/12.5%in Q1FY22. The company is dominant players in domestic differential gears with a market share in PV/CV/Tractors are 55%-60%/80%-90%/75%-85%.
-
In Q1FY22, the BEV segment contributed Rs96.7 Crore to total revenue, an increase of 33% QoQ. The revenue share from BEV stood at 20% Vs 13% in Q4FY21. The company sells one out of every eight BEV Differential globally as on H1CY21. The company has been awarded 17 BEV programs across 10 customers. The company is steadily reducing its dependence on ICE from 25.1% in FY21 to 20% in Q1FY22.
-
Most of the OEMs will be outsourcing the electric 2W motors and do not manufacture them in-house. OEMs can manufacture controller business in-house.
-
The Company’s net order book stands at Rs.140bn i.e. 9.1x FY21 revenue. EV/No-EV mix stands at 57.1%/42.9%. Most of the new order books won are from Europe. It will become sizable in FY23-24. The company has 2 European programs.
-
In Q1FY22, the mix favored China as company’s US customers were impacted more than anywhere else due to semi-conductor shortage and Indian Customers was impacted by the 2nd wave of COVID.
-
SONACOMS collaborated with IRP Nexus Group, Israel for developing the Magnet-less Motors. The product is targeted to 2W/3E EVs for global markets and SONACOMS will have the exclusive rights to manufacture the system in India. It would help in supply security as 95% of the world’s rare earth metals and 75% of neodymium magnets come from China. It would also help in cost reduction as Neodymium magnets constitute 25% of total material cost and price fluctuate abnormally due to dynamic geographic situations.
-
The Company has not lost any customer since its inception as switching cost is very high & that serves as a MOAT for the company and Out of the top 20 customers 13 customers is with the company for 15+years
-
In Q1FY22, the company is developing new products such as motors with magnets, liquid cool inverters, and active biased differential.
-
Company can pass through the increase in the cost of steel and motors. Aluminum prices cannot be passed through to customers.
-
As of Q1FY22 Companies ROCE/ROE/Net Debt to Equity stands at 35.3%/33.5%/0.02x. In FY 22 company would do capex of INR 650 crore, and in next 2-3 year will be INR 300 Crore.
Balance Sheet:
| Balance Sheet | ( In Crore) | ||
| FY 2019 | FY 2020 | FY 2021 | |
| Equity and Liabilities | |||
| Equity Share Capital | 27.72 | 47.15 | 572.98 |
| Other Equity | 148.57 | 1130.78 | 730.92 |
| Total equity | 176.29 | 1177.93 | 1303.9 |
| Liabilities | |||
| Non-current liabilities | |||
| Financial Liabilities | |||
| Borrowings | 73.33 | 176.82 | 190.7 |
| Lease Liabilities | 15.68 | 53.23 | 72.01 |
| Other financial liabilities | 0.12 | 0.12 | 0.12 |
| Provisions | 2.38 | 6.67 | 8.67 |
| Deferred Tax Liabilities (Net) | 11.05 | 107.67 | 126.02 |
| Current Liabilities | |||
| Financial Liabilities | 213.22 | 300.24 | 431.98 |
| Other Current Liabilities | 12.09 | 11.03 | 17.07 |
| Provisions | 1.57 | 5.1 | 7.26 |
| Income Tax Liabilities (Net) | 0.07 | 11.8 | 17.02 |
| Assets of Disposal group classified as held for sale | 1126.7 | ||
| Total equity and liabilities | 1632.5 | 1850.61 | 2174.75 |
| Assets | |||
| Non-Current Assets | |||
| Property, plant and equipment | 178.35 | 284.5 | 344.9 |
| Right of Used Assets | 40.51 | 141.94 | 159.26 |
| Capital Work in Progress | 13.16 | 58.13 | 82.13 |
| Goodwill | 0 | 175.8 | 175.8 |
| Other Intangible Assets | 72.39 | 462.91 | 536.62 |
| Intangible Assets Under Development | 0 | 31.5 | 1.07 |
| Financial Assets | 6.12 | 7.05 | 5.77 |
| Income Tax Assets (Net) | 1.12 | 29.14 | 18.67 |
| Other Non-Current Assets | 8.41 | 27.84 | 29.62 |
| Current assets | |||
| Inventories | 67.78 | 196.23 | 305.56 |
| Financial Assets | |||
| Trade receivables | 152.1 | 233.62 | 416.99 |
| Cash & Bank Balance | 25.6 | 167.28 | 27.56 |
| Loans | 0.01 | 0.49 | 1.5 |
| Other Financial Assets | 3.22 | 0.53 | 15.16 |
| Other Current assets | 13.04 | 33.63 | 54.15 |
| Assets of Disposal group classified as held for sale | 1050.69 | ||
| Total Assets | 1632.5 | 1850.59 | 2174.76 |
Cash Flow Statement:
| Particulars | FY 2019 | FY 2020 | FY 2021 |
| Cash Flow Summary | |||
| Cash and Cash Equivalents at Beginning of the year | 26.4 | 39.03 | 104.99 |
| Net Cash from Operating Activities | 154.61 | 253.34 | 142.73 |
| Net Cash Used in Investing Activities | 204.15 | -954.21 | -156.06 |
| Net Cash Used in Financing Activities | -346.12 | 766.82 | -66.7 |
| Net Inc/(Dec) in Cash and Cash Equivalent | 12.63 | 65.96 | -80.04 |
| Cash and Cash Equivalents at End of the year | 39.03 | 104.99 | 24.95 |
Key Financial Ratios:
| Particulars | FY 2019 | FY 2020 | FY 2021 |
| Key Ratios | |||
| Debt-Equity Ratio | 4.47 | 0.39 | 0.33 |
| Current Ratio | 1.00 | 1.08 | 1.4 |
| Interest Coverage Ratio | 13.83 | 6.92 | 10.23 |
| EBITDA Margin (%) | 39.55 | 23.78 | 27.42 |
| PAT (%) | 27.77 | 14.36 | 13.74 |
| ROCE (%) | 34.96 | 19.01 | 20.09 |
| ROE (%) | 150.28 | 22.05 | 17.34 |
Outlook:
Company is well placed in the automotive industry among its peers as it is in unique position to integrate electric powertrain (components of electric powertrain are-Differential assembly, Traction Motor, High Voltage Inverter) in a single unit. Sona Comstar is the most profitable amongst its peers in driveline business globally as company’s labour cost (8%-9% of sales) is lower as compared to its peers (20%-29% of sales). Sona Comstar is consistently growing its global market share among its various products. Company’s annual spend on R&D (3.3%/5.8% in FY20/21) is much higher than it is for Indian peers. Currently company is developing new products such as motors with magnets, liquid cool inverters, and active biased differential.
Electrification is clearly emerging as the biggest trend in the automobile industry. BEV has been the fastest growing at CAGR of approximately 46% between CY 2015 to 2025 and expected to grow at approximately 36% CAGR between FY 20-25. Within 5 years, company’s share of revenue from BEVs has increased to 20% (1QFY20). In India, electric 2W & Electric 3W is expected to grow at a CAGR 70%/46% for FY 2021-25 respectively.
We are positive on the company due to its consistent strong performance in electrical vehicle segment vehicles as well as strong order book from this segment. Hence, investors can accumulate in the range of Rs. 500-550 for target price of Rs 746. Time frame should be 9-12 months.
Disclosure in pursuance of Section 19 of SEBI (RA) Regulation 2014
Elite Wealth Limited does/does not do business with companies covered in its research reports. Investors should be aware that the Elite Wealth Limited may/may not have a conflict of interest that could affect the objectivity of this report. Investors should consider this report as only information in making their investment decision and must exercise their own judgment before making any investment decision.
For analyst certification and other important disclosures, see the Disclosure Appendix, or go to www.elitewealth.in. Analysts employed by Elite Wealth Limited are registered/qualified as research analysts with SEBI in India.( SEBI Registration No.: INH100002300)
Disclosure Appendix
Analyst Certification (For Reports)
Israil Khan, Elite Wealth Limited, suhail@elitewealth.in
The analyst(s) certify that all of the views expressed in this report accurately reflect my/our personal views about the subject company or companies and its or their securities. I/We also certify that no part of my compensation was, is or will be, directly or indirectly, related to the specific recommendations or views expressed in this report. Unless otherwise stated, the individuals listed on the cover page of this report are analysts in Elite Wealth Limited.
As to each individual report referenced herein, the primary research analyst(s) named within the report individually certify, with respect to each security or issuer that the analyst covered in the report, that:
(1) all of the views expressed in the report accurately reflect his or her personal views about any and all of the subject securities or issuers; and
(2) no part of any of the research analyst’s compensation was, is, or will be directly or indirectly related to the specific recommendations or views expressed in the report.
For individual analyst certifications, please refer to the disclosure section at the end of the attached individual notes.
Research Excerpts
This note may include excerpts from previously published research. For access to the full reports, including analyst certification and important disclosures, investment thesis, valuation methodology, and risks to rating and price targets, please visit www.elitewealth.in.
Company-Specific Disclosures
Important disclosures, including price charts, are available and all Elite Wealth Limited covered companies by visiting https://www.elitewealth.in, or emailing research@elitestock.com with your request. Elite Wealth Limited may screen companies based on Strategy, Technical, and Quantitative Research. For important disclosures for these companies, please e-mail research@elitestock.com.
Options related research:
If the information contained herein regards options related research, such information is available only to persons who have received the proper option risk disclosure documents. For a copy of the risk disclosure documents, please contact your Broker’s Representative or visit the OCC’s website at https://www.elitewealth.in
Other Disclosures
All research reports made available to clients are simultaneously available on our client websites. Not all research content is redistributed, e-mailed or made available to third-party aggregators. For all research reports available on a particular stock, please contact your respective broker’s sales person.
Ownership and material conflicts of interest Disclosure
Elite Wealth Limited policy prohibits its analysts, professionals reporting to analysts from owning securities of any company in the analyst’s area of coverage. Analyst compensation: Analysts are salary based permanent employees of Elite Wealth Limited. Analyst as officer or director: Elite Wealth Limited policy prohibits its analysts, persons reporting to analysts from serving as an officer, director, board member or employee of any company in the analyst’s area of coverage.
Country Specific Disclosures
India – For private circulation only, not for sale.
Legal Entities Disclosures
Mr. Ravinder Parkash Seth is the Managing Director of Elite Wealth Ltd (EWL, henceforth), having its registered office at Casa Picasso, Golf Course Extension, Near Rajesh Pilot Chowk, Radha Swami, Sector-61, Gurgaon-122001 Haryana, is a SEBI registered Research Analyst and is regulated by Securities and Exchange Board of India. Telephone:011-43035555, Facsimile: 011-22795783 and Website: www.elitewealth.in
EWL discloses all material information about itself including its business activity, disciplinary history, the terms and conditions on which it offers research report, details of associates and such other information as is necessary to take an investment decision, including the following:
1. Reports
a) EWL or his associate or his relative has no financial interest in the subject company and the nature of such financial interest;
(b) EWL or its associates or relatives, have no actual/beneficial ownership of one per cent. or more in the securities of the subject company, at the end of the month immediately preceding the date of publication of the research report or date of the public appearance;
(c) EWL or its associate or his relative, has no other material conflict of interest at the time of publication of the research report or at the time of public appearance;
2. Compensation
(a) EWL or its associates have not received any compensation from the subject company in the past twelve months;
(b) EWL or its associates have not managed or co-managed public offering of securities for the subject company in the past twelve months;
(c) EWL or its associates have not received any compensation for investment banking or merchant banking or brokerage services from the subject company in the past twelve months;
(d) EWL or its associates have not received any compensation for products or services other than investment banking or merchant banking or brokerage services from the subject company in the past twelve months;
(e) EWL or its associates have not received any compensation or other benefits from the Subject Company or third party in connection with the research report.
3 In respect of Public Appearances
(a) EWL or its associates have not received any compensation from the subject company in the past twelve months;
(b) The subject company is not now or never a client during twelve months preceding the date of distribution of the research report and the types of services provided by EWL


