The world is shifting to clean energy.
India is at the centre of it.
Three big changes are happening simultaneously — globally, in India, and in how money is being deployed.
 The Planet is Changing
Global leaders have set binding targets to transform energy and the economy.
- 195 countries committed to reach net zero by 2050
- By 2030, at least 50% of new car sales globally to be electric (IEA Net Zero Scenario)
 And India is Changing
In 2025, India’s coal generation fell for the first time in over 50 years.
- India can now manufacture solar modules domestically and export them
- 176.7 GW of clean energy projects already under implementation
So, Opportunities are Changing Too
- $2 : $1For every $1 into fossil fuels, nearly $2 now goes into clean energy
- ~$17TCumulative clean energy investments since 2015
- 1020×India EV registrations: 2.4k in FY15 to 24L in FY26
Source: UNFCCC | IEA World Energy Investment 2025 | MNRE | VAHAN Dashboard | CEEW. Data as of March 30, 2026.
(source: motilaloswalmf.com)
One index. The entire clean economy.
The BSE Clean Environment Index captures businesses across all five pillars of India’s clean economy in one single instrument.
Renewables
Solar, wind, hydro and storage power generators, equipment makers and transmission players. India’s 500 GW target by 2030 drives secular demand.
16 Companies
Electric Vehicles
Pure-play EV OEMs across 2W, 3W and cars. India’s registrations surged 150× in a decade and the EV30@2030 mandate demands 8–10× more.
3 Companies
Water
Water supply, treatment and infrastructure companies. 72% of India’s sewage flows untreated and a $23.85B market is being built to fix it.
3 Companies
Recycling
Metal and PET recyclers backed by binding EPR mandates. Regulatory demand, not discretionary spend, is what drives this theme.
2 Companies
Source: BSE. Data as on 30 Apr-2026. Subject to semi-annual rebalancing by BSE in June and December. Not to be used for development or implementation of an investment strategy.
(source: motilaloswalmf.com)
India’s Clean Energy Shift Has Begun.
Invest in the Businesses Powering It.
25 pure-play stocks across the clean economy. Here’s who’s in the index.
| Top 10 Constituents | Weight |
|---|---|
| Suzlon Energy Ltd. | 15.9% |
| Tata Power Co. Ltd. | 13.7% |
| Adani Green Energy Ltd. | 11.7% |
| JSW Energy Ltd. | 8.8% |
| Waaree Energies Ltd. | 8.6% |
| NHPC Ltd. | 7.5% |
| Ather Energy Ltd. | 5.2% |
| MTAR Technologies Ltd. | 4.0% |
| Premier Energies Ltd. | 3.5% |
| NTPC Green Energy Ltd. | 2.9% |
| Total (Top 10) | 81.8% |
Sector Breakdown (AMFI)
- Utilities51.9%
- Industrials36.6%
- Consumer Disc.9.4%
- Commodities1.5%
- Services0.8%
Market Cap Coverage (SEBI)
Source: BSE. Data as on 30 Apr-2026. For illustration only. Not investment advice.
(source: motilaloswalmf.com)
Not ESG. Not Energy.
Built purely around clean environment.
ESG funds can hold banks and FMCG companies. Energy funds can hold coal. This one can’t — and won’t.
| ✅ Clean Environment Index | ESG Indices | |
|---|---|---|
| Objective | Revenue from clean activities only | Score well on ESG parameters |
| Selection | >25% revenue from clean environment activities | ESG score ranking — no revenue test |
| Sectors | Renewables, EV, water, waste & recycling only | Financials, IT, Consumer & more |
| Fossil Fuels | Zero — structurally excluded | Possible — a high-scoring oil major can qualify |
| Portfolio | 25 pure-play stocks | Broad diversified basket (usually >50 stocks) |
Source: MO AMC | BSE. Not to be construed as recommendations or investment strategy.
(source: motilaloswalmf.com)
The index has outperformed peers consistently.
Higher returns with higher volatility. A long-term bet for patient investors.
| Period | BSE Clean Environment TRI | BSE 100 ESG TRI | BSE Energy TRI |
|---|---|---|---|
| Annualised Returns | |||
| 1 Year | 10.22% | 0.10% | 8.42% |
| 3 Year | 36.27% | 11.83% | 18.65% |
| 5 Year | 37.82% | 11.91% | 16.97% |
| 7 Year | 43.32% | 13.12% | 16.20% |
| Annualised Volatility | |||
| 1 Year | 22.91% | 13.43% | 14.89% |
| 3 Year | 27.05% | 12.97% | 19.35% |
| 5 Year | 26.21% | 13.79% | 19.90% |
| 7 Year | 27.44% | 17.87% | 24.29% |
Calendar Year Returns vs BSE 1000
Outperformed 6 out of 8 years. Years with higher upside also had steeper drawdowns — expected for a thematic fund.
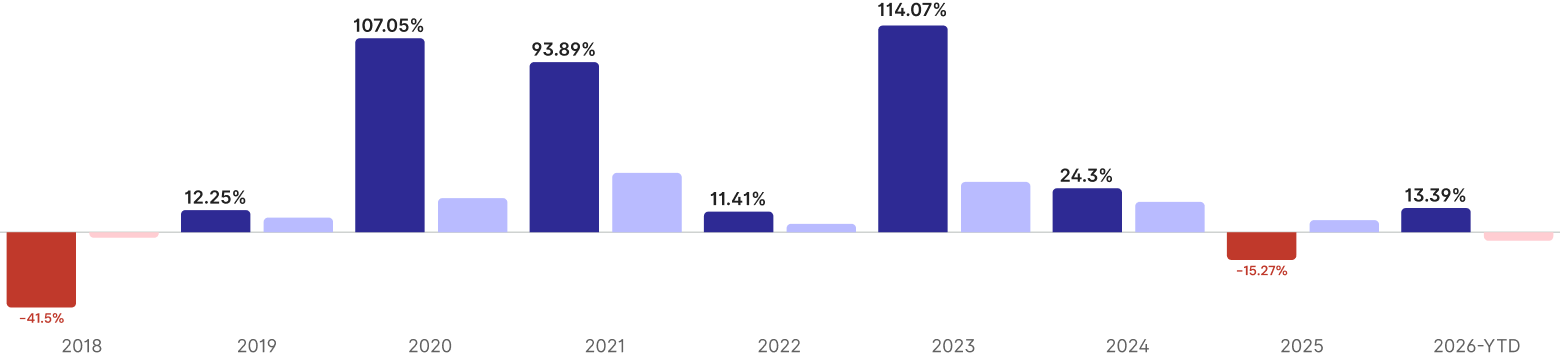
Source: BSE. Performance as on 30 Apr-2026. Past performance may or may not be sustained. Not to be used for investment strategy development.
(source: motilaloswalmf.com)
Key Facts
Lumpsum ₹500/- and in multiples of ₹1/- thereafter.Ongoing basis:
Lumpsum ₹500/- and in multiples of ₹1/- thereafter.
Multiple SIP frequency options are available, for more details,
please refer https://www.motilaloswalmf.com/
Long-term Capital Gains – 12.5% on gains above ₹1.25 lakh (held >12 months).
Short-term Capital Gains – 20% (held up to 12 months). Investors should consult their tax advisor.
Tax treatment of mutual funds is subject to change. The tax information provided is for general informational purposes only and is not intended as tax advice. Investors are advised to consult their tax advisor before making any investment decisions and tax advice.
- 1% if redeemed on or before 15 days from the date of allotment.
- Nil if redeemed after 15 days from the date of allotment.
- No load shall be imposed for switching between Options within the Scheme.
(source: motilaloswalmf.com)
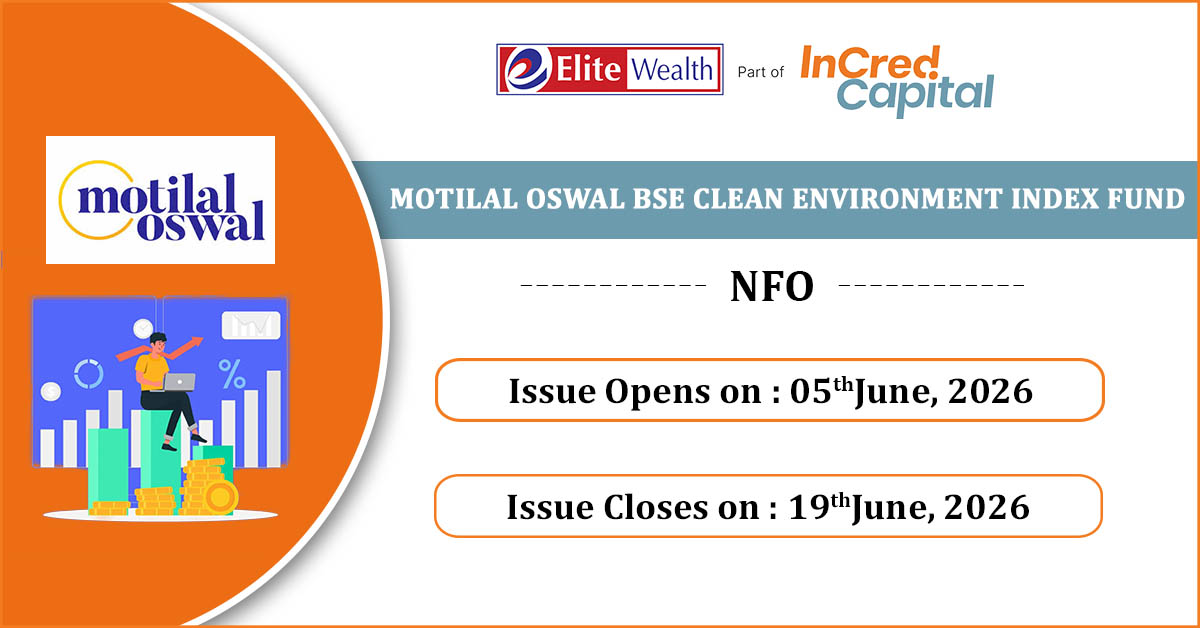
Motilal Oswal BSE Clean Environment Index Fund NFO:
| Mutual Fund | Motilal Oswal Mutual Fund |
| Scheme Name | Motilal Oswal BSE Clean Environment Index Fund |
| Objective of Scheme | The investment objective of the scheme is to provide returns that, before expenses, correspond to the total returns of the securities as represented by BSE Clean Environment Index, subject to tracking error. However, there can be no assurance or guarantee that the investment objectives of the scheme will be achieved. |
| Scheme Type | Open Ended |
| Scheme Category | Other Scheme – Index Funds |
| New Fund Launch Date | 05 Jun 2026 |
| New Fund Earliest Closure Date | |
| New Fund Offer Closure Date | 19 Jun 2026 |
| Indicate Load Separately | |
| Minimum Subscription Amount | Rs. 500/- and in multiples of Re. 1/- thereafter. |
| For Further Details Please Visit Website | https://www.motilaloswalmf.com |