| Result Analysis: Tech Mahindra Limited (CMP: Rs.1,004) |
Result Update: Q4FY23 |
Tech Mahindra is one of the leading provider of consulting-led integrated portfolio services to customers around the globe. It also provides comprehensive range of IT services, including IT enabled services, application development and maintenance, consulting and enterprise business solutions, extended engineering solutions and infrastructure management services to a diversified base of corporate customers in a wide range of industries including insurance, banking and financial services, manufacturing, telecommunications, transportation and engineering services.
| Stock Details |
| Market Cap. (Cr.) |
97825.42 |
| Equity (Cr.) |
487.08 |
| Face Value |
5 |
| 52 Wk. high/low |
1297 / 944 |
| BSE Code |
532755 |
| NSE Code |
TECHM |
| Book Value (Rs) |
275.46 |
| Sector |
IT – Software |
| Key Ratios |
| Debt-equity: |
0.11 |
| ROCE (%): |
23.78 |
| ROE (%): |
21.76 |
| TTM EPS: |
53.58 |
| P/BV: |
3.65 |
| TTM P/E: |
18.74 |
Result Highlights:
- Tech Mahindra posted muted results in the March 23 quarter with Revenue decrease of -0.1% QoQ to Rs.13,718 cr. and Net profits decrease of 12.5% QoQ to Rs.1,125 cr. majorly due to the macro headwinds and decline in discretionary spending.
- EBIT of the company declined by 7% QoQ to Rs.1,530 cr. and EBIT margin declined with 80 bps to 11.2% compared to previous quarter.
- Among industries communication and manufacturing segments’ revenue% have grown up by 30bps and 20bps respectively while Retail, Transport & logistics segment revenue % de-grew by 90bps. BFSI and Technology segment were flat on QoQ basis in the quarter.
- Across geographies, Europe revenue% increased by 90 bps while America de-grew by 10 bps on QoQ basis. While revenue% from Rest of the world showed de-growth of 80 bps on QoQ basis.
- Net New Deal wins of the company has dropped significantly (26%QoQ down) due to the cautious stands of the client to USD 0.59bn in the quarter vs USD 0.79bn of Q3FY23.
- Attrition rate has improved by 200 bps from 17% in the December 22 quarter to 15% in this quarter. Company has reduced its total headcount by 4,668 QoQ, now counts to 1,52,400.
- The board of the company has recommended a final dividend of Rs.32/share.
Financial Performance:
Shareholding Pattern:
| Particulars (In %) |
Q4FY23 |
Q4FY22 |
| Promoters Group |
35.18 |
35.26 |
| FIIs |
27.9 |
35.21 |
| DIIs |
25.85 |
18.05 |
| Public |
10.43 |
10.55 |
| Others |
0.64 |
0.93 |
Management Commentary:
- The management highlighted the macro environment remains weak considering slower decision making and cuts in discretionary spending and will impact the growth in H1FY24 as well.
- Some of the discretionary spends and transformation projects are going through additional lenses before getting released.
- Management informed that the client specific issues in top 5 clients are bottoming out and is expected to stabilize in the near term.
- Company stated that cloud, 5G and AI are providing better future growth opportunities.
Outlook:
Tech Mahindra has subdued performance in Q4FY23 with 0.1% de-growth in the revenue and 12.5% de-growth in the PAT on quarterly basis. Deal decisions have been delayed due to uncertain macros which has resulted in lower deal wins. Revenues from top 5 clients have dropped significantly over the past year. Near term headwinds still prevail for the IT companies on the back of recession fears in Europe and America. Hence, we remain negative on the stock for the short term.
Results:
| Particulars (In Rs. Cr.) |
Q4FY23 |
Q3FY23 |
Q4FY22 |
QoQ% |
YoY% |
FY23 |
FY22 |
YoY% |
| Revenue from Operations |
13,718 |
13,735 |
12,116 |
-0.1% |
13.2% |
53,290 |
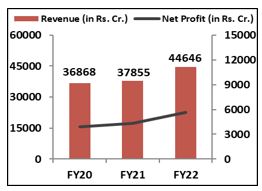
44,646 |
19.4% |
| Other Income |
306 |
247 |
320 |
23.6% |
-4.5% |
965 |
1,112 |
-13.2% |
| Total Income |
14,024 |
13,982 |
12,436 |
0.3% |
12.8% |
54,255 |
45,758 |
18.6% |
| Employee Benefit Expenses |
7,192 |
7,055 |
6,048 |
1.9% |
18.9% |
27,692 |
22,286 |
24.3% |
| Employee benefit Expenses as % of Sales |
52.4% |
51.4% |
49.9% |
110 bps |
250 bps |
51.96% |
49.92% |
200 bps |
| Subcontracting Expenses |
1,936 |
1,974 |
1,907 |
-1.9% |
1.5% |
8,000 |
6,957 |
15.0% |
| Depreciation & Amortisation Expense |
490 |
498 |
484 |
-1.6% |
1.2% |
326 |
163 |
100.2% |
| Other Expense |
2,570 |
2,562 |
2,074 |
0.3% |
23.9% |
9,569 |
7,383 |
29.6% |
| EBIT |
1,530 |
1,646 |
1,604 |
-7.0% |
-4.6% |
6,072 |
6,500 |
-6.6% |
| EBIT Margin |
11.2% |
12.0% |
13.2% |
-80 bps |
-210 bps |
11.4% |
14.6% |
-320 bps |
| Profit After Tax (PAT) |
1,125 |
1,285 |
1,545 |
-12.5% |
-27.2% |
4,831 |
5,566 |
-13.2% |
| PATM (%) |
8.2% |
9.4% |
12.8% |
-1.2% |
-4.6% |
9.07% |
12.47% |
-340 bps |
| EPS (in Rs.) |
12.67 |
14.7 |
17.09 |
-13.8% |
-25.9% |
54.8 |
63.32 |
-13.5% |
| Segment Revenue (In Rs. Cr.) |
Q4FY23 |
Revenue % |
Q3FY23 |
QoQ% |
Q4FY22 |
YoY% |
| IT |
11,797 |
86.0% |
11,800 |
-0.02% |
10,593 |
11.37% |
| BPO |
1,921 |
14.0% |
1,935 |
-0.72% |
1,524 |
26.06% |
| Total |
13,718 |
100% |
13,735 |
-0.12% |
12,116 |
13.22% |
| Geography Revenue % |
Q4FY23 |
Q3FY23 |
Q4FY22 |
QoQ |
YoY |
| America |
49.6 |
49.7 |
48.3 |
-10 bps |
130 bps |
| Europe |
25.3 |
24.4 |
26.4 |
90 bps |
-110 bps |
| Rest of the World |
25.1 |
25.9 |
25.3 |
-80 bps |
-20 bps |
| Segment Revenue % |
Q4FY23 |
Q3FY23 |
Q4FY22 |
QoQ |
YoY |
| Communications, Media & Entertainment |
40.10% |
39.80% |
40.60% |
30 bps |
-50 bps |
| Manufacturing |
15.90% |
15.70% |
14.90% |
20 bps |
100 bps |
| Technology |
10.30% |
10.30% |
9.30% |
– |
100 bps |
| Banking, Financial Services & Insurance |
15.90% |
15.90% |
17.40% |
– |
-150 bps |
| Retail, Transport & Logistics |
7.60% |
8.50% |
7.60% |
-90 bps |
– |
| Others |
10.20% |
9.90% |
10.20% |
30 bps |
– |
Source: Company website, EWL Research
Disclosure in pursuance of Section 19 of SEBI (RA) Regulation 2014
Elite Wealth Limited does/does not do business with companies covered in its research reports. Investors should be aware that the Elite Wealth Limited may/may not have a conflict of interest that could affect the objectivity of this report. Investors should consider this report as only information in making their investment decision and must exercise their own judgment before making any investment decision.
For analyst certification and other important disclosures, see the Disclosure Appendix, or go to www.elitewealth.in. Analysts employed by Elite Wealth Limited are registered/qualified as research analysts with SEBI in India.( SEBI Registration No.: INH100002300)
Disclosure Appendix
Analyst Certification (For Reports)
Israil Khan, Elite Wealth Limited, suhail@elitewealth.in
The analyst(s) certify that all of the views expressed in this report accurately reflect my/our personal views about the subject company or companies and its or their securities. I/We also certify that no part of my compensation was, is or will be, directly or indirectly, related to the specific recommendations or views expressed in this report. Unless otherwise stated, the individuals listed on the cover page of this report are analysts in Elite Wealth Limited.
As to each individual report referenced herein, the primary research analyst(s) named within the report individually certify, with respect to each security or issuer that the analyst covered in the report, that:
(1) all of the views expressed in the report accurately reflect his or her personal views about any and all of the subject securities or issuers; and
(2) no part of any of the research analyst’s compensation was, is, or will be directly or indirectly related to the specific recommendations or views expressed in the report.
For individual analyst certifications, please refer to the disclosure section at the end of the attached individual notes.
Research Excerpts
This note may include excerpts from previously published research. For access to the full reports, including analyst certification and important disclosures, investment thesis, valuation methodology, and risks to rating and price targets, please visit www.elitewealth.in.
Company-Specific Disclosures
Important disclosures, including price charts, are available and all Elite Wealth Limited covered companies by visiting https://www.elitewealth.in, or emailing research@elitestock.com with your request. Elite Wealth Limited may screen companies based on Strategy, Technical, and Quantitative Research. For important disclosures for these companies, please e-mail research@elitestock.com.
Options related research:
If the information contained herein regards options related research, such information is available only to persons who have received the proper option risk disclosure documents. For a copy of the risk disclosure documents, please contact your Broker’s Representative or visit the OCC’s website at https://www.elitewealth.in
Other Disclosures
All research reports made available to clients are simultaneously available on our client websites. Not all research content is redistributed, e-mailed or made available to third-party aggregators. For all research reports available on a particular stock, please contact your respective broker’s sales person.
Ownership and material conflicts of interest Disclosure
Elite Wealth Limited policy prohibits its analysts, professionals reporting to analysts from owning securities of any company in the analyst’s area of coverage. Analyst compensation: Analysts are salary based permanent employees of Elite Wealth Limited. Analyst as officer or director: Elite Wealth Limited policy prohibits its analysts, persons reporting to analysts from serving as an officer, director, board member or employee of any company in the analyst’s area of coverage.
Country Specific Disclosures
India – For private circulation only, not for sale.
Legal Entities Disclosures
Mr. Ravinder Parkash Seth is the Managing Director of Elite Wealth Ltd (EWL, henceforth), having its registered office at Casa Picasso, Golf Course Extension, Near Rajesh Pilot Chowk, Radha Swami, Sector-61, Gurgaon-122001 Haryana, is a SEBI registered Research Analyst and is regulated by Securities and Exchange Board of India. Telephone:011-43035555, Facsimile: 011-22795783 and Website: www.elitewealth.in
EWL discloses all material information about itself including its business activity, disciplinary history, the terms and conditions on which it offers research report, details of associates and such other information as is necessary to take an investment decision, including the following:
1. Reports
a) EWL or his associate or his relative has no financial interest in the subject company and the nature of such financial interest;
(b) EWL or its associates or relatives, have no actual/beneficial ownership of one per cent. or more in the securities of the subject company, at the end of the month immediately preceding the date of publication of the research report or date of the public appearance;
(c) EWL or its associate or his relative, has no other material conflict of interest at the time of publication of the research report or at the time of public appearance;
2. Compensation
(a) EWL or its associates have not received any compensation from the subject company in the past twelve months;
(b) EWL or its associates have not managed or co-managed public offering of securities for the subject company in the past twelve months;
(c) EWL or its associates have not received any compensation for investment banking or merchant banking or brokerage services from the subject company in the past twelve months;
(d) EWL or its associates have not received any compensation for products or services other than investment banking or merchant banking or brokerage services from the subject company in the past twelve months;
(e) EWL or its associates have not received any compensation or other benefits from the Subject Company or third party in connection with the research report.
3 In respect of Public Appearances
(a) EWL or its associates have not received any compensation from the subject company in the past twelve months;
(b) The subject company is not now or never a client during twelve months preceding the date of distribution of the research report and the types of services provided by EWL