
| Result Analysis: Bharti Airtel Ltd. (CMP: Rs.785.35) | Result Update: Q3FY23 |
Airtel is a global communications solutions provider with over 500 Mn customers in 17 countries across South Asia and Africa. The company ranks amongst the top three mobile operators globally and its networks cover over two billion people. Airtel is India’s largest integrated communications solutions provider and the second-largest mobile operator in Africa. Airtel’s retail portfolio includes high-speed 4G/5G mobile broadband, Airtel Xstream Fiber that promises speeds up to 1 Gbps with convergence across linear and on-demand entertainment, streaming services spanning music and video, digital payments, and financial services. For enterprise customers, Airtel offers a gamut of solutions that includes secure connectivity, cloud and data center services, cyber security, IoT, Ad Tech, and CPaaS (Airtel IQ).
| Stock Details | |
| Market Cap. (Cr.) | 532454 |
| Equity (Cr.) | 2786.81 |
| Face Value | 5 |
| 52 Wk. high/low | 877 / 629 |
| BSE Code | 532454 |
| NSE Code | BHARTIARTL |
| Book Value (Rs.) | 131.59 |
| Sector | Telecomm-Service |
| Key Ratios | |
| Debt-equity: | 2.65 |
| ROCE (%): | 11.26 |
| ROE (%): | 11.43 |
| TTM EPS: | 12.84 |
| P/BV: | 6.0 |
| TTM P/E: | 61.16 |
Result Highlights:
-
Total Consolidated Revenue showed robust growth of 19.88% on YoY basis and grew marginally on QoQ basis by 3.70% to Rs. 35,804.40 cr. in Q3FY23, Consolidated mobile data traffic at 13,625 PBs in the quarter with a healthy YoY growth of 23.7%.
-
Company has clocked PAT of Rs. 2,613.70 in the Dec. quarter, showing de-growth of 12.26% QoQ, whereas a growth of 58.34% YoY. The PAT margin of the company shrunk sequentially by 133 bps while expanded by 177 bps on YoY basis to 7.30%.
-
EBITDA margin of the company witnessed an increase sequentially of 72 bps and 237 bps on YoY basis to 52.26%.
-
India revenues at Rs. 24,962 crore, increased by 19.4% YoY. Mobile revenues grew by 20.8% YoY, ARPU for the quarter stood at Rs. 193 as compared to Rs. 163 in the Q3FY22.
-
Airtel has launched ‘Airtel World Pass’, one pack works seamlessly across 184 countries that will cover layover at an airport or travelling to two or more countries.
-
Airtel added 21.2 Mn 4G data customers to its network over last year, an increase of 10.8% YoY, and 65% of overall mobile customer base
- Mobile data consumption by the users up by 22.5% YoY, consumption per customer at 20.3 GB per month.
-
Homes business segment continues its strong momentum and delivers a revenue growth of 29.8% YoY. The company added 432 K customers during the quarter to reach to a total base of 5.6 Mn.
Financial Performance:
Shareholding Pattern:
| Particulars | % |
| Promoters & Promoter Group | 55.12% |
| FIIs | 22.92% |
| DIIs | 19.16% |
| Public | 2.10% |
| Others | 0.7% |
Managerial commentary:
-
Gopal Vittal, MD, said: “We have delivered another quarter of consistent and competitive growth across all our businesses. Revenue grew sequentially by 3.7%, while EBITDA margin expanded to 52.0%. Our strategy of winning quality customers has helped us add 6.4 Mn 4G customers and exit the quarter with an industry leading ARPU of Rs 193. Postpaid, Enterprise, Homes as well as our Africa business sustained their momentum while the DTH business showed signs of growth in an industry that continues to be under pressure. Our overall performance is testimony to the breadth and diversity of our portfolio that spans across both geographies as well as businesses. Our 5G rollout is on track to cover all towns and key rural areas by March 2024.”
Outlook:
Bharti Airtel posts quarterly revenues of Rs 35,804 crore up by 19.88% YoY, backed by strong and consistent performance delivery across the portfolio. However, the company reported a lower-than-expected quarterly profit even as it earned more from each user amid the 5G rollout on account of provision for license fee of Rs. 669.80 cr. related to earlier periods in one of the Group’s wholly-owned subsidiaries. ARPU of the company showed a margin growth of 1.6% sequentially which is lower than expectation, however the growth was better than industry average. For the 9MFY23 Dabur has reported the earnings of Rs.9.48 and we expect the company to close the FY23 at the eEPS of Rs.12.64. Based on the estimated earnings the company is available at PEx of 62.13 at the CMP.
Results:
| Particulars (In Rs. Cr.) | Q3FY23 | Q2FY23 | Q3FY22 | QoQ% | YoY% | 9MFY23 | 9MFY22 | YoY% |
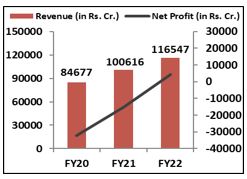
| Revenue from Operations | 35,804.40 | 34,526.80 | 29,866.60 | 3.70% | 19.88% | 1,03,135.80 | 85,046.60 | 21.27% |
| Other Income | 257.60 | 201.90 | 197.10 | 27.59% | 30.70% | 651.70 | 515.70 | 26.37% |
| Total Income | 36,062.00 | 34,728.70 | 30,063.70 | 3.84% | 19.95% | 1,03,787.50 | 85,562.30 | 21.30% |
| Network operating expenses | 7,328.40 | 7,130.30 | 6,498.60 | 2.78% | 12.77% | 21,141.50 | 18,474.70 | 14.43% |
| Access charges | 1,935.20 | 1,931.00 | 1,723.20 | 0.22% | 12.30% | 5,736.00 | 5,010.60 | 14.48% |
| License fee / Spectrum charges | 2,842.10 | 2,951.10 | 2,729.80 | -3.69% | 4.11% | 8,923.80 | 8,054.70 | 10.79% |
| Employee benefits expense | 1,235.30 | 1,208.60 | 1,133.60 | 2.21% | 8.97% | 3,567.40 | 3,269.10 | 9.12% |
| Sales and marketing expenses | 1,911.80 | 1,782.30 | 1,442.50 | 7.27% | 32.53% | 5,261.00 | 3,770.80 | 39.52% |
| Other Expenses | 2,098.40 | 1,929.70 | 1,636.10 | 8.74% | 28.26% | 5,929.70 | 4,973.10 | 19.24% |
| EBITDA | 18,710.80 | 17,795.70 | 14,899.90 | 5.14% | 25.58% | 53,228.10 | 42,009.30 | 26.71% |
| EBITDA Margin (%) | 52.26% | 51.54% | 49.89% | 72 bps | 237 bps | 51.61% | 49.40% | 221 bps |
| Finance Cost | 4,685.60 | 4,940.30 | 4,367.10 | -5.16% | 7.29% | 14,136.80 | 12,556.90 | 12.58% |
| Depreciation & Amortisation expense | 9,297.70 | 8,946.80 | 8,547.20 | 3.92% | 8.78% | 27,025.90 | 24,508.10 | 10.27% |
| Share of profit/(loss) in associated and JV | -368.40 | 356.70 | 616.10 | TA | TA | 151.10 | 1,709.60 | -91.16% |
| Exceptional items (net) | 669.80 | 0.00 | -39.80 | TA | TA | 669.80 | -792.40 | TA |
| Profit Before Tax | 3,689.30 | 4,265.30 | 2,641.50 | -13.50% | 39.67% | 11,546.70 | 7,446.30 | 55.07% |
| Tax | 1,075.60 | 1,286.40 | 990.80 | -16.39% | 8.56% | 3,485.30 | 2,856.10 | 22.03% |
| Profit After Tax | 2,613.70 | 2,978.90 | 1,650.70 | -12.26% | 58.34% | 8,061.40 | 4,590.20 | 75.62% |
| PAT Margin (%) | 7.30% | 8.63% | 5.53% | -133 bps | 177 bps | 7.82% | 5.40% | 242 bps |
| EPS (in Rs.) | 2.81 | 3.80 | 1.49 | -26.05% | 88.59% | 9.48 | 4.06 | 133.50% |
| Segment Income (In Cr.) | Q3FY23 | Q2FY23 | Q3FY22 | QoQ% | YoY% | 9MFY23 | 9MFY22 | YoY% | Segment% |
| Mobile Services India | 19,352.70 | 18,882.10 | 16,017.30 | 2.49% | 20.82% | 56,375.30 | 45,388.80 | 24.21% | 52.17% |
| Mobile Services Africa | 11,087.60 | 10,445.20 | 9,105.30 | 6.15% | 21.77% | 31,234.90 | 25,874.10 | 20.72% | 29.89% |
| Mobile Services South Asia | 77.60 | 69.50 | 97.50 | 11.65% | -20.41% | 213.80 | 288.50 | -25.89% | 0.21% |
| Airtel Business | 4,777.90 | 4,664.60 | 4,105.90 | 2.43% | 16.37% | 13,808.10 | 11,890.40 | 16.13% | 12.88% |
| Homes Services | 1,034.30 | 989.80 | 796.90 | 4.50% | 29.79% | 2,950.60 | 2,162.80 | 36.43% | 2.79% |
| Digital TV Services | 739.00 | 728.80 | 791.20 | 1.40% | -6.60% | 2,216.00 | 2,398.60 | -7.61% | 1.99% |
| Others | 26.10 | 20.40 | 8.20 | 27.94% | 218.29% | 55.50 | 26.00 | 113.46% | 0.07% |
| Total | 37,095.20 | 35,800.40 | 30,922.30 | 3.62% | 19.96% | 1,06,854.20 | 88,029.20 | 21.38% | 100.00% |
| Less: Inter segment revenue | 1,290.80 | 1,273.60 | 1,055.70 | 1.35% | 22.27% | 3,718.40 | 2,982.60 | 24.67% | – |
| Income from Operations | 35,804.40 | 34,526.80 | 29,866.60 | 3.70% | 19.88% | 1,03,135.80 | 85,046.60 | 21.27% | – |
Source: Company website, EWL Research
Disclosure in pursuance of Section 19 of SEBI (RA) Regulation 2014
Elite Wealth Limited does/does not do business with companies covered in its research reports. Investors should be aware that the Elite Wealth Limited may/may not have a conflict of interest that could affect the objectivity of this report. Investors should consider this report as only information in making their investment decision and must exercise their own judgment before making any investment decision.
For analyst certification and other important disclosures, see the Disclosure Appendix, or go to www.elitewealth.in. Analysts employed by Elite Wealth Limited are registered/qualified as research analysts with SEBI in India.( SEBI Registration No.: INH100002300)
Disclosure Appendix
Analyst Certification (For Reports)
Israil Khan, Elite Wealth Limited, suhail@elitewealth.in
The analyst(s) certify that all of the views expressed in this report accurately reflect my/our personal views about the subject company or companies and its or their securities. I/We also certify that no part of my compensation was, is or will be, directly or indirectly, related to the specific recommendations or views expressed in this report. Unless otherwise stated, the individuals listed on the cover page of this report are analysts in Elite Wealth Limited.
As to each individual report referenced herein, the primary research analyst(s) named within the report individually certify, with respect to each security or issuer that the analyst covered in the report, that:
(1) all of the views expressed in the report accurately reflect his or her personal views about any and all of the subject securities or issuers; and
(2) no part of any of the research analyst’s compensation was, is, or will be directly or indirectly related to the specific recommendations or views expressed in the report.
For individual analyst certifications, please refer to the disclosure section at the end of the attached individual notes.
Research Excerpts
This note may include excerpts from previously published research. For access to the full reports, including analyst certification and important disclosures, investment thesis, valuation methodology, and risks to rating and price targets, please visit www.elitewealth.in.
Company-Specific Disclosures
Important disclosures, including price charts, are available and all Elite Wealth Limited covered companies by visiting https://www.elitewealth.in, or emailing research@elitestock.com with your request. Elite Wealth Limited may screen companies based on Strategy, Technical, and Quantitative Research. For important disclosures for these companies, please e-mail research@elitestock.com.
Options related research:
If the information contained herein regards options related research, such information is available only to persons who have received the proper option risk disclosure documents. For a copy of the risk disclosure documents, please contact your Broker’s Representative or visit the OCC’s website at https://www.elitewealth.in
Other Disclosures
All research reports made available to clients are simultaneously available on our client websites. Not all research content is redistributed, e-mailed or made available to third-party aggregators. For all research reports available on a particular stock, please contact your respective broker’s sales person.
Ownership and material conflicts of interest Disclosure
Elite Wealth Limited policy prohibits its analysts, professionals reporting to analysts from owning securities of any company in the analyst’s area of coverage. Analyst compensation: Analysts are salary based permanent employees of Elite Wealth Limited. Analyst as officer or director: Elite Wealth Limited policy prohibits its analysts, persons reporting to analysts from serving as an officer, director, board member or employee of any company in the analyst’s area of coverage.
Country Specific Disclosures
India – For private circulation only, not for sale.
Legal Entities Disclosures
Mr. Ravinder Parkash Seth is the Managing Director of Elite Wealth Ltd (EWL, henceforth), having its registered office at Casa Picasso, Golf Course Extension, Near Rajesh Pilot Chowk, Radha Swami, Sector-61, Gurgaon-122001 Haryana, is a SEBI registered Research Analyst and is regulated by Securities and Exchange Board of India. Telephone:011-43035555, Facsimile: 011-22795783 and Website: www.elitewealth.in
EWL discloses all material information about itself including its business activity, disciplinary history, the terms and conditions on which it offers research report, details of associates and such other information as is necessary to take an investment decision, including the following:
1. Reports
a) EWL or his associate or his relative has no financial interest in the subject company and the nature of such financial interest;
(b) EWL or its associates or relatives, have no actual/beneficial ownership of one per cent. or more in the securities of the subject company, at the end of the month immediately preceding the date of publication of the research report or date of the public appearance;
(c) EWL or its associate or his relative, has no other material conflict of interest at the time of publication of the research report or at the time of public appearance;
2. Compensation
(a) EWL or its associates have not received any compensation from the subject company in the past twelve months;
(b) EWL or its associates have not managed or co-managed public offering of securities for the subject company in the past twelve months;
(c) EWL or its associates have not received any compensation for investment banking or merchant banking or brokerage services from the subject company in the past twelve months;
(d) EWL or its associates have not received any compensation for products or services other than investment banking or merchant banking or brokerage services from the subject company in the past twelve months;
(e) EWL or its associates have not received any compensation or other benefits from the Subject Company or third party in connection with the research report.
3 In respect of Public Appearances
(a) EWL or its associates have not received any compensation from the subject company in the past twelve months;
(b) The subject company is not now or never a client during twelve months preceding the date of distribution of the research report and the types of services provided by EWL


