
Result Highlights:
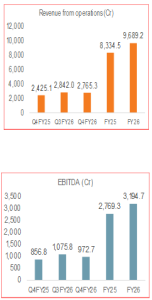
- Indian Hotels has delivered a strong financial performance in Q4FY26 and FY26, supported by healthy domestic demand, sustained expansion, and strong execution across key segments. Revenue grew 14% YoY to ₹2,765.3 crore in Q4FY26 from ₹2,425 crore in Q4FY25. For FY26, revenue increased 16.3% YoY to ₹9,689.2 crore compared to ₹8,334.5 crore in FY25, surpassing the company’s guidance of double-digit revenue growth.
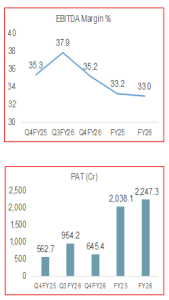
- EBITDA rose 13.5% YoY to ₹972.7 crore in Q4FY26 from ₹856.8 crore in Q4FY25. For FY26, EBITDA increased 15.4% YoY to ₹3,194.7 crore versus ₹2,769.3 crore in FY25. EBITDA margin remained stable at 35.2% in Q4FY26, while FY26 margin also remained flat at 33% compared to FY25.
- Profitability remained strong, with PAT growing 14.7% YoY to ₹645.4 crore in Q4FY26 from ₹562.7 crore in Q4FY25. For FY26, PAT increased 10.3% YoY to ₹2,247.3 crore compared to ₹2,038.1 crore in FY25.
- Segment-wise, Hotel Services revenue grew 14.13% YoY to ₹2,452.02 crore in Q4FY26 from ₹2,148.32 crore, while FY26 revenue increased 11.3% YoY to ₹8,486.63 crore from ₹7,623.24 crore. Air and Institutional Catering revenue rose 13.05% YoY to ₹314.95 crore in Q4FY26 from ₹278.59 crore and surged 68.9% YoY to ₹1,210.12 crore in FY26 from ₹716.41 crore.
- During FY26, the company added 3 new brands, taking its total brand portfolio to 14. IHCL achieved a record 250 hotel signings, expanding its portfolio to 630 hotels with an industry-leading pipeline of 255 hotels.
- It opened or on boarded over 130 hotels during the year through inorganic expansion and sustained organic growth, strengthening its presence across luxury, experiential leisure, and mid-scale segments. Operational hotels increased to 375 with an inventory exceeding 33,000 rooms.
- IHCL invested over ₹2,500 crore in capital expenditure between FY24 and FY26, primarily towards renovations of iconic properties, capability building, and strengthening long-term competitive advantages.
- Operational metrics remained healthy with overall RevPAR growing 9.3% YoY to ₹11,750 in FY26. The Taj brand continued to lead performance with RevPAR of ₹18,600 and contribution of nearly 69% to total FY26 revenue. Vivanta reported RevPAR of ₹7,700, while Ginger achieved RevPAR of ₹2,700. Domestic operations remained the key growth driver, contributing nearly 80% of total revenue during the year.
- The company declared a dividend of ₹3.25 per share, including a special dividend of ₹0.50 per share.
| Stock Details | |
| Market Cap. (₹Cr.) | 89,584 |
| Equity (₹Cr.) | 142 |
| Face Value (₹) | 1 |
| 52 Wk. high/low | 811.95 / 565 |
| BSE Code | 500850 |
| NSE Code | INDHOTEL |
| Book Value (₹) | 91.7 |
| Sector | HOTELS & RESORTS |
Management Commentary:
- Its management expressed confidence in delivering 12–14% revenue growth for FY27, supported by sustained domestic demand, new hotel openings, and stabilization of recently launched properties and acquired businesses.
- Industry fundamentals remain favorable, with limited incremental supply across key Indian markets. This supply-side constraint is enabling the company to maintain pricing power and sustain healthy occupancy levels in the 80–90% range.
- Ongoing investments in digital infrastructure and the Tajness loyalty ecosystem are strengthening customer engagement, resulting in a 2 percentage point improvement in direct website booking mix.
- The company also aims for the Ginger brand to scale up to 250 hotels (operational and pipeline) by FY27.
- During FY26, IHCL deployed approximately ₹500 crore across four strategic acquisitions, including Tree of Life and ANK Pride, which are expected to contribute around ₹250 crore in incremental revenue.
- During FY26, IHCL deployed approximately ₹500 crore across four strategic acquisitions, including Tree of Life and ANK Pride, which are expected to contribute around ₹250 crore in incremental revenue.
- The company continues to maintain a strong pipeline of over 31,000 keys and expects more than 60 hotel openings in FY27, further strengthening its leadership in the Indian hospitality sector.
- Q4FY26 performance was temporarily impacted by global disruptions, particularly the West Asia conflict, which affected inbound travel and led to airline route suspensions. Dubai hotel occupancy declined to around 25%, impacting fee income, while last-minute MICE cancellations also weighed on performance.
- IHCL has guided FY27 capex of ₹1,100–1,300 crore as part of its broader ₹5,000 crore long-term investment plan, aimed at supporting over 60 hotel openings, 750+ owned/leased keys, and renovation of iconic properties such as Taj Palace and The Taj Mahal Palace. The entire capex will be funded through internal accruals, while maintaining a strong liquidity position of over ₹4,300 crore
Outlook
Indian Hotels has delivered a strong operational and financial performance in Q4FY26 with revenue growth of 14% YoY and PAT growth of 14.7% YoY over Q4FY25. For FY26, revenue grew 16.3% and net profit grew 10.3% from last financial year, driven by strong growth momentum across segments and sustained demand strength. Domestic operations continued to be the key driver, contributing nearly 80% of total revenue, while the Taj brand remained the largest contributor at around 68.9%. It also comfortably surpassed its guided revenue growth for FY26.
Segment performance remained healthy, with Hotel Services revenue growing 11.3% YoY and Air & Institutional Catering rising sharply by 68.9% YoY in FY26. Operational metrics also remained strong, with RevPAR increasing 9.3% YoY to ₹11,750, led by the Taj brand at ₹18,600, reflecting premium positioning and pricing strength.
On the expansion front, IHCL continued aggressive portfolio growth. The brand portfolio expanded to 14 brands, supported by a record 250 hotel signings and a pipeline of 255 hotels. During FY26, the company opened or on boarded over 130 hotels, taking total operational hotels to 375 with more than 33,000 rooms.
Management remains confident of sustaining 12–14% revenue growth in FY27, supported by strong domestic demand, new hotel openings, and ramp-up of recently launched assets. The pipeline remains strong with over 31,000 keys and expected 60+ hotel openings in FY27, reinforcing leadership in the Indian hospitality sector.
Capex guidance for FY27 stands at ₹1,100–1,300 crore, part of a broader ₹5,000 crore long-term investment plan focused on expansion, renovations of iconic properties, and capability building.
Financially, the company reported EPS of ₹14.64 in FY26. At a CMP of ₹629, the stock trades at 42.96x P/E. Considering strong visibility on growth, robust domestic demand, expansion pipeline, and management confidence, the valuation appears reasonable, with potential for steady medium- to long-term performance.
Results:
| Particulars (₹ Cr) | Q4FY26 | Q3FY26 | Q4FY25 | QoQ% | YoY % | FY26 | FY25 | YoY% |
| Revenue from operations | 2,765.3 | 2,842.0 | 2,425.1 | -2.7 | 14.0 | 9,689.2 | 8,334.5 | 16.3 |
| Food and Beverages Consumed | 257.6 | 276.9 | 234.9 | -7.0 | 9.7 | 950.9 | 773.8 | 22.9 |
| Employee Benefit Expenses | 656.5 | 641.5 | 588.2 | 2.3 | 11.6 | 2,486.7 | 2,150.7 | 15.6 |
| Other expenses | 878.5 | 847.7 | 745.2 | 3.6 | 17.9 | 3,057.0 | 2,640.8 | 15.8 |
| Total Expenses | 1,792.6 | 1,766.1 | 1,568.4 | 1.5 | 14.3 | 6,494.6 | 5,565.2 | 16.7 |
| EBITDA | 972.7 | 1,075.8 | 856.8 | -9.6 | 13.5 | 3,194.7 | 2,769.3 | 15.4 |
| Margin (%) | 35.2 | 37.9 | 35.3 | -7.1 | -0.4 | 33.0 | 33.2 | -0.8 |
| Depreciation and amortisation expense | 167.4 | 150.3 | 142.0 | 11.3 | 17.9 | 605.2 | 518.2 | 16.8 |
| EBIT | 805.3 | 925.5 | 714.8 | -13.0 | 12.7 | 2,589.5 | 2,251.2 | 15.0 |
| Exceptional items | 0.0 | 275.5 | -2.6 | -100.0 | -100.0 | 275.5 | 304.8 | -9.6 |
| Other income | 79.5 | 58.3 | 61.6 | 36.4 | 29.0 | 282.2 | 230.5 | 22.5 |
| Finance costs | 54.9 | 55.8 | 53.9 | -1.6 | 1.9 | 221.4 | 208.4 | 6.2 |
| Share of Profit/(Loss} of Associates and Joint Ventures (net of tax) | 20.2 | 19.9 | 22.7 | 1.5 | -10.8 | 52.1 | 76.8 | -32.2 |
| EBT | 850.1 | 1,223.4 | 742.6 | -30.5 | 14.5 | 2,978.0 | 2,654.9 | 12.2 |
| Tax | 204.7 | 269.1 | 180.0 | -24.0 | 13.7 | 730.7 | 616.8 | 18.5 |
| PAT | 645.4 | 954.2 | 562.7 | -32.4 | 14.7 | 2,247.3 | 2,038.1 | 10.3 |
| EPS | 4.2 | 6.4 | 3.7 | 14.6 | 13.4 |
Source: Company website, EWL Research
Disclosure in pursuance of Section 19 of SEBI (RA) Regulation 2014
Elite Wealth Limited (Elite Wealth Limited is wholly owned subsidiary of InCred Capital Financial Services Limited) does/does not do business with companies covered in its research reports. Investors should be aware that the Elite Wealth Limited may/may not have a conflict of interest that could affect the objectivity of this report. Investors should consider this report as only information in making their investment decision and must exercise their own judgment before making any investment decision.
For analyst certification and other important disclosures, see the Disclosure Appendix, or go to www.elitewealth.in. Analysts employed by Elite Wealth Limited are registered/qualified as research analysts with SEBI in India. (SEBI Registration No.: INH100002300)
Disclosure Appendix
Analyst Certification (For Reports)
Vindhyachal Prasad, Elite Wealth Limited, vindhyachal@elitestock.com
The analyst(s) certify that all of the views expressed in this report accurately reflect my/our personal views about the subject company or companies and its or their securities. I/We also certify that no part of my compensation was, is or will be, directly or indirectly, related to the specific recommendations or views expressed in this report. Unless otherwise stated, the individuals listed on the cover page of this report are analysts in Elite Wealth Limited.
As to each individual report referenced herein, the primary research analyst(s) named within the report individually certify, with respect to each security or issuer that the analyst covered in the report, that:
- All of the views expressed in the report accurately reflect his or her personal views about any and all of
the subject securities or issuers; and
- No part of any of the research analyst’s compensation was, is, or will be directly or indirectly related to the specific recommendations or views expressed in the For individual analyst certifications, please refer to the disclosure section at the end of the attached individual notes.
Research Excerpts
This note may include excerpts from previously published research. For access to the full reports, including analyst certification and important disclosures, investment thesis, valuation methodology, and risks to rating and price targets, please visit www.elitewealth.in.
Company-Specific Disclosures
Important disclosures, including price charts, are available and all Elite Wealth Limited covered companies by visiting https://www.elitewealth.in, or emailing research@elitestock.com with your request. Elite Wealth Limited may screen companies based on Strategy, Technical, and Quantitative Research. For important disclosures for these companies, please e-mail research@elitestock.com.
Options related research:
If the information contained herein regards options related research, such information is available only to persons who have received the proper option risk disclosure documents. For a copy of the risk disclosure documents, please contact your Broker’s Representative or visit the OCC’s website at https://www.elitewealth.in
Other Disclosures
All research reports made available to clients are simultaneously available on our client websites. Not all research content is redistributed, e-mailed or made available to third-party aggregators. For all research reports available on a particular stock, please contact your respective broker’s sales person.
Ownership and material conflicts of interest Disclosure
Elite Wealth Limited policy prohibits its analysts, professionals reporting to analysts from owning securities of any company in the analyst’s area of coverage. Analyst compensation: Analysts are salary based permanent employees of Elite Wealth Limited. Analyst as officer or director: Elite Wealth Limited policy prohibits its analysts, persons reporting to analysts from serving as an officer, director, board member or employee of any company in the analyst’s area of coverage.
Country Specific Disclosures
India – For private circulation only, not for sale. Legal
Entities Disclosures
Elite Wealth Ltd (EWL, henceforth), having its registered office at Casa Picasso, Golf Course Extension, Near Rajesh Pilot Chowk, Radha Swami, Sector-61, Gurgaon-122001 Haryana, is a SEBI registered Research Analyst and is regulated by Securities and Exchange Board of India. Telephone: 011-43035555, Facsimile: 011-22795783 and Website: www.elitewealth.in
EWL discloses all material information about itself including its business activity, disciplinary history, the terms and conditions on which it offers research report, details of associates and such other information as is necessary to take an investment decision, including the following:
- Reports
- EWL or his associate or his relative has no financial interest in the subject company and the nature of such financial interest;
- EWL or its associates or relatives, have no actual/beneficial ownership of one %. or more in the securities of the subject company, at the end of the month immediately preceding the date of publication of the research report or date of the public appearance;
- EWL or its associate or his relative, has no other material conflict of interest at the time of publication of the research report or at the time of public appearance;
- Compensation
- EWL or its associates have not received any compensation from the subject company in the past twelve months;
- EWL or its associates have not managed or co-managed public offering of securities for the subject company in the past twelve months;
- EWL or its associates have not received any compensation for investment banking or merchant banking or brokerage services from the subject company in the past twelve months;
- EWL or its associates have not received any compensation for products or services other than investment banking or merchant banking or brokerage services from the subject company in the past twelve months;
- EWL or its associates have not received any compensation or other benefits from the Subject Company or third party in connection with the research
- In respect of Public Appearances
- EWL or its associates have not received any compensation from the subject company in the past twelve months;
- The subject company is not now or never a client during twelve months preceding the date of distribution of the research report and the types of services provided by EWL


