
| Result Analysis: HCL Technologies Limited (CMP: Rs.1048) | Result Update: Q4FY23 |
HCL Technologies Limited is the leading IT solutions provider in India and across 54 countries globally. The company is engaged in providing a range of software development services, business process outsourcing services and information technology (IT) infrastructure services. The company helps enterprises to transform their businesses through digital technology transformation. The revenue segments of HCL Technologies include IT & business services, Engineering & R&D services and Products & Platforms.
| Stock Details | |
| Market Cap. (Cr.) | 284636.34 |
| Equity (Cr.) | 542.73 |
| Face Value | 2 |
| 52 Wk. high/low | 1157 / 876 |
| BSE Code | 532281 |
| NSE Code | HCLTECH |
| Book Value (Rs) | 225.68 |
| Sector | IT – Software |
| Key Ratios | |
| Debt-equity: | 0.11 |
| ROCE (%): | 24.59 |
| ROE (%): | 22.2 |
| EPS: | 53.29 |
| P/BV: | 4.3 |
| P/E: | 19.47 |
Result Highlights:
- The company experienced a slight decrease in revenue of 0.4% QoQ to Rs.26,606 cr. and a 2.8% QoQ decline in net profit to Rs.3,981 cr. The primary factor contributing to this performance decline was the cuts in the discretionary spending and ramp downs & deferrals of projects.
- EBIT Margin of the company also declined by 140 bps QoQ in the quarter and stands at 18.2%.
- Among segments, Products & Platforms segment showed major growth decline of 14% QoQ basis. Engineering, R&D services also declined by 3% QoQ while IT & Business services grew by 3% QoQ in the quarter.
- Across geographies, Europe and Rest of the world showed de-growth of 30 bps and 10 bps respectively on QoQ basis while America showed growth of 30 bps QoQ.
- Company won 13 large deals in Q4FY23 compared to previous quarter of 17 deals. Total TCV of the company stands at $2.07 billion, down by 8% YoY.
- In Q4, the attrition rate decreased from 21.7% in Q3FY23 to 19.5%. Additionally, the company hired 3,674 new employees, bringing the total headcount to 225,944.
- HCL Tech announced an interim dividend of Rs.18 per share.
Financial Performance:
Shareholding Pattern:
| Particulars (In %) | Q3FY23 | Q3FY22 |
| Promoters Group | 60.72 | 60.33 |
| FIIs | 18.81 | 20.96 |
| DIIs | 15.91 | 13.74 |
| Public | 4.19 | 4.5 |
| Others | 0.4 | 0.5 |
Management Commentary:
Commenting on the December quarter results, C Vijayakumar, CEO and MD said, our pipeline is near all-time high, which reflects our differentiated business mix and strong client demand for our offerings. We have added 3,674 employees this quarter and overall employee strength has now grown beyond 225000. All these set us well in FY24 for a healthy revenue growth in 6-8 percent range with operating margins in 18-19 percent range.
Outlook:
HCL Technologies showed subdued performance in Q4FY23 with 0.4% QoQ decline in revenue and 2.8% QoQ decline in the net profits majorly due to delay in decision making related to discretionary spending. The company saw strong growth in BFSI segment on the back of large deals ramp up while telecom, manufacturing, and high-tech segments were stressed in the quarter. The management has restated its medium-term target for EBIT margin, which remains at 19-20 percent. In addition, the company’s guidance for service revenue growth for FY24 is between 6.5-8.5 percent, indicating a higher rate of growth than that of Infosys. HCL tech is poised to grow due to the ongoing digital transformation; however, short to mid-term outlook for the company remain cautious due to the prevailing recession fears in America and Europe.
Results:
| Particulars (In Rs. Cr.) | Q4FY23 | Q3FY23 | Q4FY22 | QoQ | YoY | FY23 | FY22 | YoY |
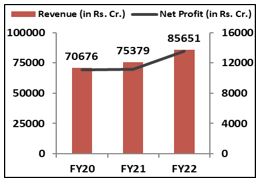
| Revenue from Operations | 26,606 | 26,700 | 22,597 | -0.4% | 17.7% | 1,01,456 | 85,651 | 18.5% |
| Other Income | 453 | 260 | 317 | 74.2% | 42.9% | 1,358 | 1,067 | 27.3% |
| Total Income | 27,059 | 26,960 | 22,914 | 0.4% | 18.1% | 1,02,814 | 86,718 | 18.6% |
| Employee Benefit Expenses | 14,665 | 14,163 | 12,603 | 3.5% | 16.4% | 55,280 | 46,130 | 19.8% |
| Employee benefit Expenses as % of Sales | 55.1% | 53.0% | 55.8% | 210 bps | -70 bps | 54.5% | 53.9% | 60 bps |
| Purchase of Stock-In-Trade | 577 | 648 | 448 | -11.0% | 28.8% | 2,072 | 1,473 | 40.7% |
| Change in Inventories | -14 | 6 | -41 | -333.3% | -65.9% | -67 | -67 | 0.0% |
| Outsourcing Expenses | 3,786 | 3,865 | 3,210 | -2.0% | 17.9% | 14,950 | 12,515 | 19.5% |
| Depreciation & Amortisation Expense | 1,027 | 1,137 | 984 | -9.7% | 4.4% | 4,145 | 4,326 | -4.2% |
| Other Expense | 1,729 | 1,653 | 1,324 | 4.6% | 30.6% | 6,593 | 5,070 | 30.0% |
| EBIT | 4,836 | 5,228 | 4,069 | -7.5% | 18.8% | 18,483 | 16,204 | 14.1% |
| EBIT Margin | 18.2% | 19.6% | 18.0% | -140 bps | 20 bps | 18.2% | 18.9% | -70 bps |
| Profit After Tax (PAT) | 3,981 | 4,096 | 3,599 | -2.8% | 10.6% | 14,845 | 13,523 | 9.8% |
| PAT Margin | 15.0% | 15.3% | 15.9% | -40 bps | -100 bps | 14.63% | 15.79% | -120 bps |
| EPS (In Rs.) | 14.71 | 15.13 | 13.27 | -2.8% | 10.9% | 54.85 | 48.77 | 12.5% |
| Segment Revenue (In Rs. Cr.) | Q4FY23 | Revenue % | Q3FY23 | Q4FY22 | QoQ% | YoY% |
| IT & Business Services | 19,632 | 74% | 19,141 | 16,581 | 3% | 18% |
| Engineering & R&D services | 4,274 | 16% | 4,425 | 3,699 | -3% | 16% |
| Products & Platforms | 2,700 | 10% | 3,134 | 2,317 | -14% | 17% |
| Geography Revenue % | Q4FY23 | Q3FY23 | Q4FY22 | QoQ | YoY | FY23 | FY22 | YoY |
| America | 63.8 | 63.5 | 63.1 | 30 bps | 70 bps | 64.1 | 63.1 | 100 bps |
| Europe | 28.9 | 29.1 | 28.7 | -20 bps | 20 bps | 28.4 | 28.7 | -30 bps |
| Rest of the World | 7.3 | 7.4 | 8.2 | -10 bps | -90 bps | 7.6 | 8.2 | -60 bps |
Source: Company website, EWL Research
Disclosure in pursuance of Section 19 of SEBI (RA) Regulation 2014
Elite Wealth Limited does/does not do business with companies covered in its research reports. Investors should be aware that the Elite Wealth Limited may/may not have a conflict of interest that could affect the objectivity of this report. Investors should consider this report as only information in making their investment decision and must exercise their own judgment before making any investment decision.
For analyst certification and other important disclosures, see the Disclosure Appendix, or go to www.elitewealth.in. Analysts employed by Elite Wealth Limited are registered/qualified as research analysts with SEBI in India.( SEBI Registration No.: INH100002300)
Disclosure Appendix
Analyst Certification (For Reports)
Israil Khan, Elite Wealth Limited, suhail@elitewealth.in
The analyst(s) certify that all of the views expressed in this report accurately reflect my/our personal views about the subject company or companies and its or their securities. I/We also certify that no part of my compensation was, is or will be, directly or indirectly, related to the specific recommendations or views expressed in this report. Unless otherwise stated, the individuals listed on the cover page of this report are analysts in Elite Wealth Limited.
As to each individual report referenced herein, the primary research analyst(s) named within the report individually certify, with respect to each security or issuer that the analyst covered in the report, that:
(1) all of the views expressed in the report accurately reflect his or her personal views about any and all of the subject securities or issuers; and
(2) no part of any of the research analyst’s compensation was, is, or will be directly or indirectly related to the specific recommendations or views expressed in the report.
For individual analyst certifications, please refer to the disclosure section at the end of the attached individual notes.
Research Excerpts
This note may include excerpts from previously published research. For access to the full reports, including analyst certification and important disclosures, investment thesis, valuation methodology, and risks to rating and price targets, please visit www.elitewealth.in.
Company-Specific Disclosures
Important disclosures, including price charts, are available and all Elite Wealth Limited covered companies by visiting https://www.elitewealth.in, or emailing research@elitestock.com with your request. Elite Wealth Limited may screen companies based on Strategy, Technical, and Quantitative Research. For important disclosures for these companies, please e-mail research@elitestock.com.
Options related research:
If the information contained herein regards options related research, such information is available only to persons who have received the proper option risk disclosure documents. For a copy of the risk disclosure documents, please contact your Broker’s Representative or visit the OCC’s website at https://www.elitewealth.in
Other Disclosures
All research reports made available to clients are simultaneously available on our client websites. Not all research content is redistributed, e-mailed or made available to third-party aggregators. For all research reports available on a particular stock, please contact your respective broker’s sales person.
Ownership and material conflicts of interest Disclosure
Elite Wealth Limited policy prohibits its analysts, professionals reporting to analysts from owning securities of any company in the analyst’s area of coverage. Analyst compensation: Analysts are salary based permanent employees of Elite Wealth Limited. Analyst as officer or director: Elite Wealth Limited policy prohibits its analysts, persons reporting to analysts from serving as an officer, director, board member or employee of any company in the analyst’s area of coverage.
Country Specific Disclosures
India – For private circulation only, not for sale.
Legal Entities Disclosures
Mr. Ravinder Parkash Seth is the Managing Director of Elite Wealth Ltd (EWL, henceforth), having its registered office at Casa Picasso, Golf Course Extension, Near Rajesh Pilot Chowk, Radha Swami, Sector-61, Gurgaon-122001 Haryana, is a SEBI registered Research Analyst and is regulated by Securities and Exchange Board of India. Telephone:011-43035555, Facsimile: 011-22795783 and Website: www.elitewealth.in
EWL discloses all material information about itself including its business activity, disciplinary history, the terms and conditions on which it offers research report, details of associates and such other information as is necessary to take an investment decision, including the following:
1. Reports
a) EWL or his associate or his relative has no financial interest in the subject company and the nature of such financial interest;
(b) EWL or its associates or relatives, have no actual/beneficial ownership of one per cent. or more in the securities of the subject company, at the end of the month immediately preceding the date of publication of the research report or date of the public appearance;
(c) EWL or its associate or his relative, has no other material conflict of interest at the time of publication of the research report or at the time of public appearance;
2. Compensation
(a) EWL or its associates have not received any compensation from the subject company in the past twelve months;
(b) EWL or its associates have not managed or co-managed public offering of securities for the subject company in the past twelve months;
(c) EWL or its associates have not received any compensation for investment banking or merchant banking or brokerage services from the subject company in the past twelve months;
(d) EWL or its associates have not received any compensation for products or services other than investment banking or merchant banking or brokerage services from the subject company in the past twelve months;
(e) EWL or its associates have not received any compensation or other benefits from the Subject Company or third party in connection with the research report.
3 In respect of Public Appearances
(a) EWL or its associates have not received any compensation from the subject company in the past twelve months;
(b) The subject company is not now or never a client during twelve months preceding the date of distribution of the research report and the types of services provided by EWL


