
Max Healthcare Institute Limited (Max Healthcare) is one of India’s largest healthcare service providers, providing integrated healthcare services through a network of primary care clinics, multi-specialty hospitals, medical centres, and super-specialty hospitals. It delivers secondary and tertiary care across a wide spectrum of specialties, with main centres of excellence in oncology, neurosciences, cardiac sciences, orthopaedics, renal sciences, liver and biliary sciences, and minimal access metabolic and bariatric surgery (MAMBS). Max Healthcare operates two strategic business units – Max@Home, which provides home-based healthcare and wellness services, and Max Lab, which offers pathology services outside the hospital network. It operates 22 healthcare facilities with over 5,200 beds, supported by more than 5,700 clinicians across 30+ specialties, mainly focused in NCR Delhi, Haryana, Punjab, Uttarakhand, Maharashtra, and Uttar Pradesh.
| Recommendation
ACCUMULATE |
Accumulation Price
Rs. 1050-1010 |
Target Price
Rs. 1250 |
Time Horizon
12 Months |
| Stock Details | |
| Market Cap.(₹Cr) | 1,02,093 |
| Equity (₹Cr.) | 972.77 |
| Face Value | 10 |
| 52 Wk. high/low (₹) | 1314.30 / 934 |
| BSE Code | 543220 |
| NSE Code | MAXHEALTH |
| Book Value (₹) | 95.3 |
| Industry | Healthcare- Hospital |
| TTM P/E | 72.25x |
| Share Holding Pattern % | |
| Promoters | 23.71 |
| FIIs | 45.39 |
| Institutions | 26.32 |
| Public | 4.58 |
Price Chart
Key Investment Rationale:
- It has established multiple strategic partnerships with leading global and domestic universities, including Boston University (US), Imperial College and Aston University (UK), Deakin University, IIT Bombay and Delhi, and BITS Pilani. These collaborations span a wide spectrum of research initiatives, fostering academic excellence, innovation, knowledge exchange, and industry-relevant outcomes.
- It is implementing one of India’s largest hospital expansion programs, adding ~3,000+ beds through multiple brownfield projects across Delhi NCR, Mohali, Lucknow, Gurgaon, Thane, and Nagpur. Near-term capacity additions at Nanavati, Max Smart, and Mohali are expected to drive immediate growth, while larger projects provide visibility through FY28–FY29, supporting sustained medium- to long-term earnings compounding.
- Max Healthcare is adding approximately 1,500 beds in FY26, including 1,000 brownfield and 500 greenfield beds. Major projects include Nanavati, Max Smart Saket, Lucknow, Sector 56 Gurgaon, and Nagpur, all progressing well, with phased commissioning expected over the year. These expansions will strengthen capacity, enhance specialty services, and drive incremental revenue growth across the network.
- Digital adoption, AI-driven diagnostics, and remote care platforms improve efficiency, reduce costs, and expand patient reach. These initiatives enhance patient experience and ensure long-term scalability, aligning with the industry’s digital healthcare transformation.
- It’s Board approved a Share Purchase Agreement to acquire Yerawada Properties Pvt. Ltd. and develop a ~450-bed super-speciality hospital in Pune. The phased acquisition involves ~₹200 crore for equity and total investment of ~₹1,020 crore over four years, funded through internal accruals and debt, supporting capacity expansion in a high-demand healthcare market.
- CGHS tariff revision is expected to add approx. ₹200 crore annual revenue, including CGHS-linked accounts like ECHS. Around 85% flows directly to EBITDA, implying ₹150–160 crore incremental EBITDA. Partial implementation has begun, with full impact expected by FY27, once super-specialty codes are fully activated across government portals.
- It reported revenue from operations of ₹2,067.52 crore in Q3FY26, registering a growth of 10.7% YoY compared to ₹1,868.31 crore in Q3FY25. However, on a QoQ basis, revenue declined by 3.18% from ₹2,135.47 crore in Q2FY26. And it reported a PAT of ₹300.92 crore in Q3FY26, marking a robust YoY growth of 26% compared to ₹238.80 crore in Q3FY25. However, PAT declined significantly by 38.75% QoQ from ₹491.30 crore in Q2FY26.
Management Commentary on the business & its future prospects:
- The company is using technology across its hospitals to improve efficiency and quality of care, such as a nursing app that helps track patient vitals and treatments, reducing manual work and errors.
- It is expanding oncology services, especially radiation oncology, at newer hospitals like Dwarka and Lucknow, where management sees strong and long-term demand.
- Dwarka hospital is already running at high occupancy of around 81%, while Noida is at about 64% and gradually improving after receiving necessary licences.
- New capacity added through brownfield expansions is breaking even quickly, and margins should improve further as utilisation increases.
- Cash flows were temporarily impacted due to delayed payments from government schemes like CGHS and ECHS, which is a regular, seasonal issue and should normalise.
- The company is spending heavily on expansion, which has increased debt, but this is driven by growth plans rather than any operational weakness.
- Management explained that insured and self-pay patients are similar in behaviour, so insurance-related issues mainly affect the mix, not overall patient volumes.
- Max@Home, which started in metro cities, is seeing strong demand in tier-2 cities, prompting expansion into locations like Lucknow, Dwarka, Nagpur, and Noida.
- Competition in Noida and Lucknow is limited, and the Jaypee acquisition gave the company an immediate presence, with nearby land allowing easy future expansion.
Q3FY26 Result Analysis
- It reported revenue from operations of ₹2,067.52 crore in Q3FY26, registering a growth of 10.7% YoY compared to ₹1,868.31 crore in Q3FY25. However, on a QoQ basis, revenue declined by 3.18% from ₹2,135.47 crore in Q2FY26.
- EBITDA stood at ₹490.10 crore in Q3FY26, reflecting a YoY growth of 15.2% from ₹425.50 crore in Q3FY25. However, EBITDA declined by 14.78% QoQ from ₹575.15 crore in Q2FY26, suggesting margin pressure on a sequential basis.
- The EBITDA margin was reported at 23.70% in Q3FY26, improving from 22.77% in Q3FY25 on a YoY basis. However, it declined from 26.93% in Q2FY26 on a QoQ basis.
- The company reported a PAT of ₹300.92 crore in Q3FY26, marking a robust YoY growth of 26% compared to ₹238.80 crore in Q3FY25. However, PAT declined significantly by 38.75% QoQ from ₹491.30 crore in Q2FY26.
- On a quarterly basis, performance was impacted due to a temporary shift toward institutional patients, disruption in cashless insurance services, and regulatory changes like GST reduction and CGHS pricing revisions.
- Average occupancy for the Network stood at 74%, compared to 75% in Q3FY25 and 77% in the trailing quarter, despite an 8% YoY increase in operational bed capacity. Occupied bed days were up by 7% YoY, but dipped by 4% QoQ due to seasonality.
- It has taken a significant step to expand its geographic presence in Western India by planning the development of a 450-bed hospital on a prime land in Pune, targeted for completion by 2030. Additionally, the Board has approved the addition of 260 beds at Max Dwarka, increasing the hospital’s total capacity to 560 beds.
- Average Revenue Per Occupied Bed (ARPOB) for the quarter stood at ₹77,900, reflecting a growth of 3% YoY. On a sequential basis, ARPOB improved marginally from ₹77,300 reported in Q2FY26.
- Management expects oncology contribution to gradually increase again, as it has been growing structurally over the past few years, driven by rising cancer cases and increasing demand for specialized treatments.
- Despite concerns regarding rising hospital capacity, management believes supply growth remains moderate at around 5% CAGR, while demand continues to be robust, particularly in key regions such as NCR. In markets like Gurgaon, strong inflow of patients from nearby regions and intercity demand is expected to absorb incremental capacity, thereby limiting long-term competitive pressures.
- In terms of capex, the company is on track to spend around ₹1,900 crore in FY26, although actual spending may be slightly lower due to conservative planning and timing differences in project execution.
Profit and Loss Statement:
| Particulars (In Cr) | Q3FY26 | Q3FY25 | Q2FY26 | QoQ% | YoY% | FY25 | FY24 | YoY% |
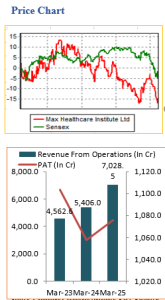
| Sales | 2067.52 | 1868.31 | 2135.47 | -3.2 | 10.7 | 7028.46 | 5406.02 | 30 |
| Other Income | 45.38 | 33.3 | 32.9 | 37.9 | 36.3 | 155.64 | 178.07 | -12.6 |
| Total Income | 2112.9 | 1901.61 | 2168.37 | -2.6 | 11.1 | 7184.1 | 5584.09 | 28.7 |
| Total Expenditure | 1577.42 | 1442.81 | 1560.32 | 1.1 | 9.3 | 5253.29 | 3913.9 | 34.2 |
| EBIDT | 535.48 | 458.8 | 608.05 | -11.9 | 16.7 | 1930.81 | 1670.19 | 15.6 |
| Interest | 59.67 | 52.39 | 53.92 | 10.7 | 13.9 | 165.02 | 59.89 | 175.5 |
| EBDT | 475.81 | 406.41 | 554.13 | -14.1 | 17.1 | 1765.79 | 1610.3 | 9.7 |
| Depreciation | 111.27 | 97.54 | 108.1 | 2.9 | 14.1 | 359.42 | 244.98 | 46.7 |
| EBT | 364.54 | 308.87 | 446.03 | -18.3 | 18 | 1406.37 | 1365.32 | 3 |
| Tax | 46 | 90.98 | 10.29 | 347.0 | -49.4 | 336.11 | 271.25 | 23.9 |
| Deferred Tax | 17.62 | -20.91 | -55.56 | -131.7 | 184.3 | -5.62 | 36.43 | -115.4 |
| PAT | 300.92 | 238.8 | 491.3 | -38.8 | 26 | 1075.88 | 1057.64 | 1.7 |
Balance Sheet:
| Particulars (In Cr) | FY25 | FY24 | FY23 | FY22 | FY21 |
| SOURCES OF FUNDS : | |||||
| Share Capital | 972.14 | 971.91 | 970.92 | 969.61 | 965.95 |
| Reserves Total | 8408.73 | 7436.23 | 6438.62 | 5312.86 | 4672.73 |
| Equity Application Money | 0 | 0 | 0.05 | 0 | 0 |
| Total Shareholders’ Funds | 9380.87 | 8408.14 | 7409.59 | 6282.47 | 5638.68 |
| Secured Loans | 2488.83 | 1149.12 | 564.32 | 726.65 | 915.85 |
| Unsecured Loans | 521.46 | 149.83 | 124.64 | 186.73 | 185.56 |
| Total Debt | 3010.29 | 1298.95 | 688.96 | 913.38 | 1101.41 |
| Other Liabilities | 604.04 | 639.77 | 605.1 | 668.4 | 534.1 |
| Total Liabilities | 12995.2 | 10346.86 | 8703.65 | 7864.25 | 7274.19 |
| APPLICATION OF FUNDS : | |||||
| Gross Block | 13342.39 | 9965.52 | 7958.37 | 7759.6 | 7099.22 |
| Less: Accumulated Depreciation | 1840.8 | 1181.83 | 919.67 | 742.02 | 562.84 |
| Net Block | 11501.59 | 8783.69 | 7038.7 | 7017.58 | 6536.38 |
| Capital Work in Progress | 900.72 | 553.04 | 252.43 | 151.12 | 26.93 |
| Investments | 2.89 | 2.12 | 0.51 | 0.51 | 0.51 |
| Current Assets, Loans & Advances | |||||
| Inventories | 106.21 | 79.84 | 76.23 | 61.36 | 53.8 |
| Sundry Debtors | 687.31 | 462.69 | 336.12 | 385.36 | 365.89 |
| Cash and Bank | 681.89 | 1099.27 | 1468.07 | 499.31 | 652.92 |
| Loans and Advances | 117.16 | 64.38 | 62.65 | 54.26 | 51.86 |
| Total Current Assets | 1592.57 | 1706.18 | 1943.07 | 1000.29 | 1124.47 |
| Less : Current Liabilities and Provisions | |||||
| Current Liabilities | 1492.26 | 1077.08 | 912.7 | 601.79 | 648.9 |
| Provisions | 78.83 | 61.15 | 48.37 | 41.68 | 39.43 |
| Total Current Liabilities | 1571.09 | 1138.23 | 961.07 | 643.47 | 688.33 |
| Net Current Assets | 21.48 | 567.95 | 982 | 356.82 | 436.14 |
| Deferred Tax Assets | 357.54 | 139.4 | 149.67 | 162.11 | 0.98 |
| Deferred Tax Liability | 977.69 | 654.25 | 586.8 | 843.52 | 581.92 |
| Net Deferred Tax | -620.15 | -514.85 | -437.13 | -681.41 | -580.94 |
| Other Assets | 1188.67 | 954.91 | 867.14 | 1019.63 | 855.17 |
| Total Assets | 12995.2 | 10346.86 | 8703.65 | 7864.25 | 7274.19 |
Cash Flow Statement:
| Particulars (In Cr) | FY25 | FY24 | FY23 | FY22 | FY21 |
| Cash and Cash Equivalents at Beginning of the year | 979.84 | 1374.33 | 480.97 | 626.59 | 111.01 |
| Net Cash from Operating Activities | 1459.31 | 1121.8 | 1284.13 | 748.49 | 117.86 |
| Net Cash Used in Investing Activities | -1614.11 | -1252.55 | -102.21 | -771.77 | 206.39 |
| Net Cash Used in Financing Activities | -163.8 | -263.74 | -288.56 | -294.17 | 191.33 |
| Net Inc/(Dec) in Cash and Cash Equivalent | -318.6 | -394.49 | 893.36 | -317.45 | 515.58 |
| Cash and Cash Equivalents at End of the year | 661.24 | 979.84 | 1374.33 | 309.14 | 626.59 |
Source: Company website, EWL Research
Outlook:
Max Healthcare is one of a India’s largest healthcare providers, offering integrated primary, secondary, and tertiary care through clinics, multi-specialty, and super-specialty hospitals, with centres of excellence in oncology, neurosciences, cardiology, orthopaedics, renal, liver, and metabolic-bariatric surgery. It is executing one of India’s largest hospital expansion programs, targeting ~ 3,000+ additional beds across Delhi NCR, Mohali, Lucknow, Gurgaon, Thane, and Nagpur. In FY26, it plans to add ~1,500 beds, including 1,000 brownfield and 500 Greenfield beds, driving near-term growth while strengthening long-term capacity. Strategic partnerships with global and domestic universities, along with digital adoption, AI-driven diagnostics, and remote care platforms, enhance clinical excellence, operational efficiency, and patient reach, supporting sustainable volume-led growth and profitability.
On a TTM basis, it reported an EPS of ₹14.52 and is trading at a P/E of 72.25x at the current market price of ₹1,049 per share. Thus, we recommend an Accumulate rating on the stock, with a price range of ₹1,050 – 1,010 and a target price of ₹1,250 within an investment horizon of 12 months.
Disclosure in pursuance of Section 19 of SEBI (RA) Regulation 2014
Elite Wealth Limited does/does not do business with companies covered in its research reports. Investors should be aware that the Elite Wealth Limited may/may not have a conflict of interest that could affect the objectivity of this report. Investors should consider this report as only information in making their investment decision and must exercise their own judgment before making any investment decision.
For analyst certification and other important disclosures, see the Disclosure Appendix, or go to www.elitewealth.in. Analysts employed by Elite Wealth Limited are registered/qualified as research analysts with SEBI in India. (SEBI Registration No.: INH100002300)
Disclosure Appendix
Analyst Certification (For Reports)
Vindhyachal Prasad, Elite Wealth Limited, vindhyachal@elitestock.com
The analyst(s) certify that all of the views expressed in this report accurately reflect my/our personal views about the subject company or companies and its or their securities. I/We also certify that no part of my compensation was, is or will be, directly or indirectly, related to the specific recommendations or views expressed in this report. Unless otherwise stated, the individuals listed on the cover page of this report are analysts in Elite Wealth Limited.
As to each individual report referenced herein, the primary research analyst(s) named within the report individually certify, with respect to each security or issuer that the analyst covered in the report, that:
- all of the views expressed in the report accurately reflect his or her personal views about any and all of the subject securities or issuers; and
- No part of any of the research analyst’s compensation was, is, or will be directly or indirectly related to the specific recommendations or views expressed in the For individual analyst certifications, please refer to the disclosure section at the end of the attached individual notes.
Research Excerpts
This note may include excerpts from previously published research. For access to the full reports, including analyst certification and important disclosures, investment thesis, valuation methodology, and risks to rating and price targets, please visit www.elitewealth.in.
Company-Specific Disclosures
Important disclosures, including price charts, are available and all Elite Wealth Limited covered companies by visiting https://www.elitewealth.in, or emailing research@elitestock.com with your request. Elite Wealth Limited may screen companies based on Strategy, Technical, and Quantitative Research. For important disclosures for these companies, please e-mail research@elitestock.com.
Options related research:
If the information contained herein regards options related research, such information is available only to persons who have received the proper option risk disclosure documents. For a copy of the risk disclosure documents, please contact your Broker’s Representative or visit the OCC’s website at https://www.elitewealth.in
Other Disclosures
All research reports made available to clients are simultaneously available on our client websites. Not all research content is redistributed, e-mailed or made available to third-party aggregators. For all research reports available on a particular stock, please contact your respective broker’s sales person.
Ownership and material conflicts of interest Disclosure
Elite Wealth Limited policy prohibits its analysts, professionals reporting to analysts from owning securities of any company in the analyst’s area of coverage. Analyst compensation: Analysts are salary based permanent employees of Elite Wealth Limited. Analyst as officer or director: Elite Wealth Limited policy prohibits its analysts, persons reporting to analysts from serving as an officer, director, board member or employee of any company in the analyst’s area of coverage.
Country Specific Disclosures
India – For private circulation only, not for sale. Legal Entities Disclosures
Mr. Ravinder Parkash Seth is the Managing Director of Elite Wealth Ltd (EWL, henceforth), having its registered office at Casa Picasso, Golf Course Extension, Near Rajesh Pilot Chowk, Radha Swami, Sector-61, Gurgaon-122001 Haryana, is a SEBI registered Research Analyst and is regulated by Securities and Exchange Board of India. Telephone: 011-43035555, Facsimile: 011-22795783 and Website: www.elitewealth.in
EWL discloses all material information about itself including its business activity, disciplinary history, the terms and conditions on which it offers research report, details of associates and such other information as is necessary to take an investment decision, including the following:
- Reports
- a) EWL or his associate or his relative has no financial interest in the subject company and the nature of such financial interest;
- EWL or its associates or relatives, have no actual/beneficial ownership of one %. or more in the securities of the subject company, at the end of the month immediately preceding the date of publication of the research report or date of the public appearance;
- EWL or its associate or his relative, has no other material conflict of interest at the time of publication of the research report or at the time of public appearance;
- Compensation
- EWL or its associates have not received any compensation from the subject company in the past twelve months;
- EWL or its associates have not managed or co-managed public offering of securities for the subject company in the past twelve months;
- EWL or its associates have not received any compensation for investment banking or merchant banking or brokerage services from the subject company in the past twelve months;
- EWL or its associates have not received any compensation for products or services other than investment banking or merchant banking or brokerage services from the subject company in the past twelve months;
- EWL or its associates have not received any compensation or other benefits from the Subject Company or third party in connection with the research
- In respect of Public Appearances
- EWL or its associates have not received any compensation from the subject company in the past twelve months;
The subject company is not now or never a client during twelve months preceding the date of distribution of the research report and the types of services provided by EWL


