
Result Highlights:
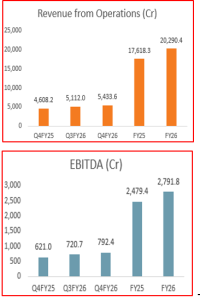
- Tata Consumer reported a strong operational performance in Q4FY26, with revenue from operations rising 17.9% YoY to ₹5,433.6 crore from ₹4,608.2 crore in Q4FY25, while growing 6.3% QoQ from ₹5,112 crore in Q3FY26. For FY26, revenue increased 15.2% YoY to ₹20,290.4 crore from ₹17,618.3 crore in FY25, supported by robust growth across domestic and international businesses.
- EBITDA for Q4FY26 stood at ₹792.4 crore, registering a strong 27.6% YoY growth from ₹621 crore and 10% QoQ growth from ₹720.7 crore. FY26 EBITDA increased 12.6% YoY to ₹2,791.8 crore from ₹2,479.4 crore in FY25.
- EBITDA margin improved to 14.6% in Q4FY26, up 110.9 bps YoY and 48.6 bps QoQ, driven by premiumisation initiatives and operational efficiencies across segments. However, FY26 EBITDA margin moderated by 31.3 bps to 13.8% due to softness during the first half of the fiscal year.
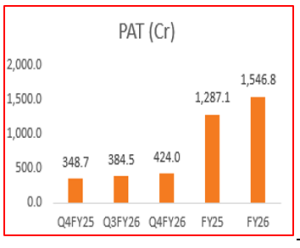
- It delivered healthy profitability growth, with Q4FY26 PAT rising 21.6% YoY to ₹424 crore from ₹348.7 crore and 10.3% QoQ from ₹384.5 crore. For FY26, PAT grew 20.2% YoY to ₹1,546.8 crore from ₹1,287.1 crore, supported by broad-based segmental growth and improved operating performance.
- India Tea volumes grew 4% during the quarter, although revenue remained marginally lower as the benefit of lower input costs was passed on to consumers. The Coffee business maintained strong momentum, reporting 20% revenue growth during the quarter.
- • India business segment recorded 13% YoY growth to ₹3,328 crore in Q4FY26, while FY26 revenue rose 14% YoY to ₹12,779 crore. India Foods business delivered strong growth, with Q4FY26 revenue rising 21% YoY to ₹1,766 crore, while FY26 revenue increased 18% YoY to ₹6,588 crore. Salt revenue grew 12% during the quarter, marking the fifth consecutive quarter of double-digit growth, supported by strong volume expansion. India Beverages revenue stood at ₹1,615 crore, reflecting 4% growth.
- International business segment maintained strong momentum, reporting 19% growth in Q4FY26 to ₹1,418 crore, driven primarily by the US Coffee business. FY26 international revenue stood at ₹5,251 crore, reflecting 15% growth.
- Non-Branded business delivered accelerated growth, with Q4FY26 revenue rising 43% YoY to ₹714 crore, while FY26 revenue increased 25% YoY to ₹2,387 crore.
- Tata Sampann continued to witness strong traction, with revenue surging 69% during the quarter, supported by robust growth across categories. The company also expanded its protein snacking portfolio with the launch of Protein Crunch Makhana and Hi-Protein Edamame, targeting health-conscious consumers.
- Capital Foods strengthened its convenience food portfolio through the launch of Manchurian and Schezwan Cup Noodles, further enhancing its presence in the ready-to-eat snacking segment.
- Innovation remained a key growth driver, with 80 new product launches during FY26 across Health & Wellness, Convenience, and Premiumisation categories. Innovation-to-sales contribution stood at a best-in-class 4.5%.
- It’s retail business delivered 7% revenue growth in FY26, supported by strong operating leverage that drove double-digit EBITDA growth. Q4FY26 sales growth stood at 7% YoY, marking the third consecutive quarter of positive same-store sales growth (SSSG), while full-year SSSG also turned positive. The company expanded its retail footprint with 23 net new store additions during FY26, taking the total store count to 502 stores.
- The Board has declared a dividend of ₹10 per share for FY26.
| Stock Details | |
| Market Cap. (₹Cr.) | 1,26,072 |
| Equity (₹Cr.) | 99 |
| Face Value (₹) | 1 |
| 52 Wk. high/low | 1,279.40/1,007.20 |
| BSE Code | 500800 |
| NSE Code | TATACONSUM |
| Book Value (₹) | 220 |
| Sector | FMCG |
Management Commentary:
- Management has guided for sustained double-digit revenue growth in FY27, supported by continued momentum across core and emerging business segments.
- Shipping disruptions in the Middle East impacted international exports and transshipment operations through Dubai during March. However, management highlighted that operations normalized by April, limiting the long-term impact on business performance.
- The Vietnam coffee extraction plant is currently operating at 99% utilization. To support future growth in the non-branded segment, the Board has approved capacity expansion plans for both the Vietnam coffee business and tea extracts operations in India.
- Management remains confident of delivering annual EBITDA margin expansion of 50–80 bps. Despite quarterly seasonality, the company aims to grow profitability at a faster pace than its double-digit revenue growth target.
- Tea prices remain relatively benign, with inflation currently around 5% YoY, while coffee prices have started moderating. Management stated that the company remains agile and prepared to undertake pricing actions if broad-based inflationary pressures or fuel costs increase.
- Advertising and Promotion (A&P) expenditure as a percentage of sales is expected to normalize within the 7.5%–8.5% range. The company plans to maintain strong brand visibility to support aggressive expansion across its growth and innovation portfolios.
- Specialized growth businesses, including NourishCo, Tata Sampann, and the Ready-to-Drink portfolio, are expected to sustain strong momentum with growth projected at nearly 30% in the near term.
- Management expects Tata Sampann margins to gradually improve toward mid-teen levels as scale benefits and portfolio expansion continue to strengthen operating leverage.
Outlook
Tata Consumer has delivered a strong financial performance in Q4FY26, reporting revenue growth of 17.9% YoY and PAT growth of 21.6% YoY compared to Q4FY25. For FY26, the company continued its healthy growth trajectory with revenue increasing 15.2% YoY and PAT rising 20.2% YoY over FY25, reflecting strong execution across key business segments.
It’s Indian business segment remained a key growth driver, delivering 14% YoY revenue growth in FY26, while International business reported 15% YoY growth supported by continued momentum in the coffee portfolio. Non-Branded business segment also posted an impressive 25% YoY growth, aided by strong demand and capacity utilization improvements.
Management has guided for sustained double-digit revenue growth in FY27, supported by healthy demand trends across businesses, continued innovation, premiumisation initiatives, and expansion in high-growth categories. It is also targeting annual EBITDA margin expansion of 50–80 bps through operational efficiencies and scale benefits. However, management remains watchful of geopolitical uncertainties, particularly the ongoing West Asia conflict and its potential impact on global trade and logistics.
The company reported an EPS of ₹15.58 for FY26 and is currently trading at a CMP of ₹1,274, implying a P/E multiple of 81.77x. The valuations appear elevated at current levels, but the company’s consistent execution, strong brand portfolio, expanding growth businesses, and management’s confidence in sustaining long-term growth provide comfort regarding future earnings potential. Considering these factors, the stock remains well-positioned to deliver healthy performance over the medium to long-term investment horizon.
Results:
| Particulars (Cr) | Q4FY26 | Q3FY26 | Q4FY25 | QoQ% | YoY % | FY26 | FY25 | YoY% |
| Revenue from Operations | 5,433.6 | 5,112.0 | 4,608.2 | 6.3 | 17.9 | 20,290.4 | 17,618.3 | 15.2 |
| Cost of materials and services consumed | 1,924.5 | 1,842.5 | 1,865.6 | 4.5 | 3.2 | 7,788.2 | 6,997.4 | 11.3 |
| Purchases of stock-in-trade | 1,158.0 | 1,045.9 | 889.5 | 10.7 | 30.2 | 4,108.2 | 3,434.4 | 19.6 |
| Changes in inventories of finished goods, stock-in-trade and work-in-progress | 108.9 | 36.8 | -78.5 | 196.1 | 238.6 | -40.8 | -362.5 | 88.8 |
| Employee benefits expense | 434.2 | 434.5 | 343.6 | -0.1 | 26.4 | 1,661.0 | 1,430.1 | 16.1 |
| Other expenses | 1,015.7 | 1,031.6 | 967.1 | -1.5 | 5.0 | 3,982.0 | 3,639.6 | 9.4 |
| Total Expenes | 4,641.2 | 4,391.3 | 3,987.3 | -1.5 | 5.0 | 17,498.6 | 15,139.0 | 145.2 |
| EBITDA | 792.4 | 720.7 | 621.0 | 10.0 | 27.6 | 2,791.8 | 2,479.4 | 12.6 |
| Margin | 14.6 | 14.1 | 13.5 | 3.4 | 8.2 | 13.8 | 14.1 | -2.2 |
| Depreciation and amortisation expense | 165.2 | 159.3 | 153.1 | 3.7 | 7.9 | 626.7 | 600.7 | 4.3 |
| EBIT | 627.2 | 561.4 | 467.9 | 11.7 | 34.1 | 2,165.1 | 1,878.6 | 15.3 |
| Share of profit of associates and toint ventures | -67.2 | -18.3 | -58.4 | 267.8 | 15.2 | -90.7 | -93.2 | -2.7 |
| Other Income | 52.6 | 33.0 | 56.5 | 59.2 | -7.0 | 164.8 | 193.3 | -14.7 |
| Exceptional items | 2.8 | -22.9 | 45.3 | -112.2 | -93.8 | -20.1 | -5.1 | 292.6 |
| Finance costs | 38.4 | 31.6 | 40.0 | 21.5 | -3.9 | 137.0 | 290.2 | -52.8 |
| EBT | 577.0 | 521.6 | 471.4 | 10.6 | 22.4 | 2,082.1 | 1,683.3 | 23.7 |
| TAX | 153.0 | 137.1 | 122.6 | 11.5 | 24.7 | 535.3 | 396.2 | 35.1 |
| PAT | 424.0 | 384.5 | 348.7 | 10.3 | 21.6 | 1,546.8 | 1,287.1 | 20.2 |
| EPS | 4.24 | 3.88 | 3.49 | 9.3 | 21.5 | 15.58 | 13.06 | 19.3 |
Source: Company website, EWL Research
Disclosure in pursuance of Section 19 of SEBI (RA) Regulation 2014
Elite Wealth Limited (Elite Wealth Limited is wholly owned subsidiary of InCred Capital Financial Services Limited) does/does not do business with companies covered in its research reports. Investors should be aware that the Elite Wealth Limited may/may not have a conflict of interest that could affect the objectivity of this report. Investors should consider this report as only information in making their investment decision and must exercise their own judgment before making any investment decision.
For analyst certification and other important disclosures, see the Disclosure Appendix, or go to www.elitewealth.in. Analysts employed by Elite Wealth Limited are registered/qualified as research analysts with SEBI in India. (SEBI Registration No.: INH100002300)
Disclosure Appendix
Analyst Certification (For Reports)
Vindhyachal Prasad, Elite Wealth Limited, vindhyachal@elitestock.com
The analyst(s) certify that all of the views expressed in this report accurately reflect my/our personal views about the subject company or companies and its or their securities. I/We also certify that no part of my compensation was, is or will be, directly or indirectly, related to the specific recommendations or views expressed in this report. Unless otherwise stated, the individuals listed on the cover page of this report are analysts in Elite Wealth Limited.
As to each individual report referenced herein, the primary research analyst(s) named within the report individually certify, with respect to each security or issuer that the analyst covered in the report, that:
- All of the views expressed in the report accurately reflect his or her personal views about any and all of
the subject securities or issuers; and
- No part of any of the research analyst’s compensation was, is, or will be directly or indirectly related to the specific recommendations or views expressed in the For individual analyst certifications, please refer to the disclosure section at the end of the attached individual notes.
Research Excerpts
This note may include excerpts from previously published research. For access to the full reports, including analyst certification and important disclosures, investment thesis, valuation methodology, and risks to rating and price targets, please visit www.elitewealth.in.
Company-Specific Disclosures
Important disclosures, including price charts, are available and all Elite Wealth Limited covered companies by visiting https://www.elitewealth.in, or emailing research@elitestock.com with your request. Elite Wealth Limited may screen companies based on Strategy, Technical, and Quantitative Research. For important disclosures for these companies, please e-mail research@elitestock.com.
Options related research:
If the information contained herein regards options related research, such information is available only to persons who have received the proper option risk disclosure documents. For a copy of the risk disclosure documents, please contact your Broker’s Representative or visit the OCC’s website at https://www.elitewealth.in
Other Disclosures
All research reports made available to clients are simultaneously available on our client websites. Not all research content is redistributed, e-mailed or made available to third-party aggregators. For all research reports available on a particular stock, please contact your respective broker’s sales person.
Ownership and material conflicts of interest Disclosure
Elite Wealth Limited policy prohibits its analysts, professionals reporting to analysts from owning securities of any company in the analyst’s area of coverage. Analyst compensation: Analysts are salary based permanent employees of Elite Wealth Limited. Analyst as officer or director: Elite Wealth Limited policy prohibits its analysts, persons reporting to analysts from serving as an officer, director, board member or employee of any company in the analyst’s area of coverage.
Country Specific Disclosures
India – For private circulation only, not for sale. Legal
Entities Disclosures
Elite Wealth Ltd (EWL, henceforth), having its registered office at Casa Picasso, Golf Course Extension, Near Rajesh Pilot Chowk, Radha Swami, Sector-61, Gurgaon-122001 Haryana, is a SEBI registered Research Analyst and is regulated by Securities and Exchange Board of India. Telephone: 011-43035555, Facsimile: 011-22795783 and Website: www.elitewealth.in
EWL discloses all material information about itself including its business activity, disciplinary history, the terms and conditions on which it offers research report, details of associates and such other information as is necessary to take an investment decision, including the following:
- Reports
- EWL or his associate or his relative has no financial interest in the subject company and the nature of such financial interest;
- EWL or its associates or relatives, have no actual/beneficial ownership of one %. or more in the securities of the subject company, at the end of the month immediately preceding the date of publication of the research report or date of the public appearance;
- EWL or its associate or his relative, has no other material conflict of interest at the time of publication of the research report or at the time of public appearance;
- Compensation
- EWL or its associates have not received any compensation from the subject company in the past twelve months;
- EWL or its associates have not managed or co-managed public offering of securities for the subject company in the past twelve months;
- EWL or its associates have not received any compensation for investment banking or merchant banking or brokerage services from the subject company in the past twelve months;
- EWL or its associates have not received any compensation for products or services other than investment banking or merchant banking or brokerage services from the subject company in the past twelve months;
- EWL or its associates have not received any compensation or other benefits from the Subject Company or third party in connection with the research
- In respect of Public Appearances
- EWL or its associates have not received any compensation from the subject company in the past twelve months;
- The subject company is not now or never a client during twelve months preceding the date of distribution of the research report and the types of services provided by EWL


