
State Bank of India (SBI), a Fortune 500 company, is a leading Indian multinational public sector banking and financial services institution headquartered in Mumbai. With a legacy spanning over 200 years, SBI is the most trusted bank in India, serving over 500 million customers. The bank boasts an asset base of over ₹61 trillion and operates through a vast network of 22,500 branches, 63,580 ATMs, and 82,900 BC outlets. SBI’s diversified portfolio includes subsidiaries such as SBI General Insurance, SBI Life Insurance, SBI Mutual Fund, and SBI Card. With a global presence across 241 offices in 29 countries, SBI continues to innovate and deliver sustainable, customer-centric banking solutions, upholding its core values of service, transparency, ethics, and sustainability.
| Result Analysis: State Bank Of India (SBI)
(CMP: Rs. 725) |
Result Update: Q3FY25 |
| Stock Details | |
| Market Cap. (Cr.) | 6,46,946 |
| Equity (Cr.) | 892.46 |
| Face Value | 1 |
| 52 Wk. high/low | 912/680 |
| BSE Code | 500112 |
| NSE Code | SBIN |
| Book Value (Rs) | 519 |
| Sector | Banks – Public Sector |
| Key Ratios | |
| GNPA (%) | 2.07 |
| NNPA (%): | 0.53 |
| ROE (%): | 18.81 |
| TTM EPS: | 81.75 |
| P/BV: | 1.4 |
| TTM P/E: | 8.95 |
| ROA (%) | 1.04 |
| NIM | 3.01 |
Result Highlights:
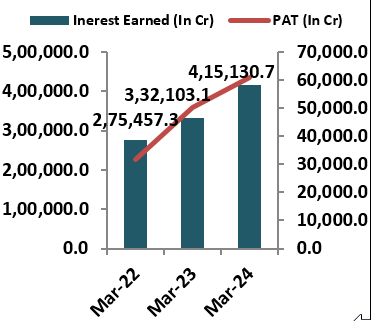
- The bank reported an Interest Earned of INR 117,426.63 crore in Q3 FY’25, reflecting a 10% growth from INR 106,733.78 crore in Q3 FY’24 on a YoY basis. On a QoQ basis, it increased by 3.12% from INR 113,870.56 crore in Q2 FY’25. Net Interest Income (NII) stood at INR 41,446 crore, up by 4.1% YoY from INR 39,816 crore. However, NII declined by 0.4% QoQ from INR 41,620 crore in Q2 FY’25.
- The bank reported Total Deposits of INR 5,229,384 crore in Q3 FY’25, reflecting a 9.8% growth from INR 4,762,221 crore in Q3 FY’24 on a YoY basis. On a QoQ basis, deposits increased by 2.19% from INR 5,117,285 crore in Q2 FY’25. Total Advances stood at INR 4,067,752 crore, reflecting a 13.5% YoY increase from INR 3,584,252 crore and a 3.75% growth QoQ from INR 3,920,719 crore in Q2 FY’25.
- The bank’s Gross Non-Performing Asset (GNPA) ratio stood at 2.07% in Q3 FY’25, down from 2.42% in Q3 FY’24 on a YoY basis. On a QoQ basis, it decreased from 2.13% in Q2 FY’25. The Net Non-Performing Asset (NNPA) ratio stood at 0.53% in Q3 FY’25, improving from 0.64% in Q3 FY’24. The NNPA ratio remained flat QoQ at 0.53% from Q2 FY’25, reflecting improved asset quality.
- The Provision Coverage Ratio (PCR) stood at 74.66% in Q3 FY’25, an increase from 74.17% in Q3 FY’24 on a YoY basis. However, on a QoQ basis, the PCR slightly decreased from 75.66% in Q2 FY’25. The robust coverage ratio indicates the bank’s prudent provisioning for potential loan losses, ensuring it has adequate reserves to cover non-performing assets, contributing to enhanced financial resilience and asset quality.
- The bank’s CASA (Current Account Savings Account) ratio stood at 39.20% in Q3 FY’25, lower than 41.18% in Q3 FY’24 on a YoY basis. On a QoQ basis, it decreased from 40.03% in Q2 FY’25. This decline is attributed to the change in deposit composition, but the CASA ratio remains healthy, reflecting a stable core deposit base and low-cost funding, which supports profitability and liquidity management for the bank.
Financial Performance:
Shareholding Pattern:
| Particulars (In %) | Q3FY25 | Q3FY24 |
| Promoters Group | 57.43 | 57.49 |
| FIIs | 10.27 | 10.91 |
| DIIs | 24.79 | 24.15 |
| Public and others | 7.35 | 7.40 |
| Government | 0.14 | 0.03 |
Management Commentary:
- The bank has seen a decrease in its SMA1 (Special Mention Accounts 1) category, with a reduction in the number of accounts. However, SMA2 has risen due to a significant account entering the category. Despite this, the bank remains confident that the increase in SMA2 is temporary and that asset quality remains stable.
- The bank’s NIM outlook remains strong, with a target of maintaining NIMs above 3%. If there is a rate cut, the bank estimates that its NIMs would be affected marginally, but it does not expect a significant negative impact, as the bank’s core focus is on high-quality advances.
- The bank’s credit cost guidance remains at 50 bps, even amid favorable asset quality trends. The bank has consistently shown an improvement in asset quality over the past five years and remains confident that this positive cycle will continue without significant credit cost increases.
Outlook:
State Bank of India (SBI) presents a positive outlook, reflecting strong growth in key financial metrics. With a 10% YoY increase in interest earned and a robust 13.5% growth in total advances, the bank remains well-positioned for sustained profitability. The improvement in asset quality, marked by a decline in GNPA and NNPA ratios, enhances its financial resilience. Despite a slight dip in CASA ratio, the bank’s liquidity and funding remain stable. The management’s confidence in maintaining a healthy Net Interest Margin (NIM) and its stable credit cost guidance further supports an optimistic outlook. SBI continues to show resilience and growth potential for long-term investors.
Results (Standalone):
| Particulars (In Cr) | Q3FY25 | Q2FY25 | Q3FY24 | QoQ% | YoY % | FY24 | FY23 | YoY % |
| Interest Earned | 124653.66 | 121044.68 | 112868.34 | 3.0 | 10.4 | 439188.5 | 350844.59 | 25.2 |
| Other Income | 43199.91 | 42757.7 | 40203.3 | 1.0 | 7.5 | 155386.39 | 122533.56 | 26.8 |
| Total Income | 167853.56 | 163802.38 | 153071.64 | 2.5 | 9.7 | 594574.88 | 473378.13 | 25.6 |
| Operating Expenses | 140288.98 | 130742.23 | 136381.55 | 7.3 | 2.9 | 495629.89 | 379795.3 | 30.5 |
| Operating Profit Before Prov. & Cont. | 27564.59 | 33060.15 | 16690.09 | -16.6 | 65.2 | 98945.02 | 93582.84 | 5.7 |
| Provisions & Contingencies | 1998.19 | 5585.84 | 1445.25 | -64.2 | 38.3 | 7704.97 | 18184.28 | -57.6 |
| EBT | 25566.4 | 27474.31 | 15244.83 | -6.9 | 67.7 | 91240.04 | 75398.56 | 21 |
| Provision for Taxes | 6391.05 | 7254.69 | 3962.17 | -11.9 | 61.3 | 23101.78 | 18840.13 | 22.6 |
| Net Profit | 19175.35 | 20219.62 | 11282.66 | -5.2 | 70.0 | 68138.26 | 56558.43 | 20.5 |
Segment Revenue (Standalone):
| Particulars (In Cr) | Q3FY25 | Q2FY25 | Q3FY24 | QoQ% | YoY % |
| Treasury Operations | 30852.47 | 34039.09 | 32224.44 | -9.4 | -4.3 |
| Corporate/Wholesale Banking Operations | 35954.13 | 36905.89 | 32715.65 | -2.6 | 9.9 |
| Retail Banking Operations: | |||||
| a) Digital Banking | 1338.72 | 1382.62 | 1321.94 | -3.2 | 1.3 |
| b) Other Retail Banking | 60082.77 | 56813.51 | 51190.31 | 5.8 | 17.4 |
Segment Revenue (Consolidated):
| Particulars (In Cr) | Q3FY25 | Q2FY25 | Q3FY24 | QoQ% | YoY % |
| Treasury Operations | 30852.47 | 34039.09 | 32224.44 | -9.4 | -4.3 |
| Corporate/Wholesale Banking Operations | 35954.13 | 36905.89 | 32715.65 | -2.6 | 9.9 |
| Retail Banking Operations: | |||||
| a) Digital Banking | 1338.72 | 1382.62 | 1321.94 | -3.2 | 1.3 |
| b) Other Retail Banking | 60082.77 | 56813.51 | 51190.31 | 5.8 | 17.4 |
| Insurance Business | 32264.61 | 28158.68 | 28491.9 | 14.6 | 13.2 |
| Other Banking operations | 7624.57 | 8068.82 | 7266.03 | -5.5 | 4.9 |
| Unallocated | 250.39 | 11.11 | 750.81 | 2153.7 | -66.7 |
Balance Sheet (Standalone):
| Particulars (In Cr) | Q3FY25 | Q2FY25 | Q3FY24 | QoQ% | YoY % |
| Capital and Liabilities | |||||
| a) Capital | 892.46 | 892.46 | 892.46 | 0 | 0 |
| b) Reserves & Surplus | 434513.91 | 368061.45 | 376354.07 | 18.1 | 15.5 |
| c) Deposits | 5229384.48 | 4762220.69 | 4916076.77 | 9.8 | 6.4 |
| d) Borrowings | 709135.25 | 552488.92 | 552488.92 | 28.4 | 28.4 |
| e) Other liabilities and Provisions | 246748.34 | 281952.77 | 288809.73 | -12.5 | -14.6 |
| Total | 6620674.44 | 5965616.29 | 6134621.95 | 11.0 | 7.9 |
| Assets | |||||
| a) Cash and balances with RBI | 233683.87 | 211029.32 | 225141.7 | 10.7 | 3.8 |
| b) Balances with banks and money at call and short notice | 102581.73 | 56152.15 | 85660.29 | 82.7 | 19.8 |
| c) Investments | 1808628.94 | 1689406.3 | 1671339.66 | 7.1 | 8.2 |
| d) Advances | 4004566.94 | 3519514.28 | 3703970.85 | 13.8 | 8.1 |
| e) Fixed assets | 43389.23 | 42501.36 | 42617.25 | 2.1 | 1.8 |
| f) Other assets | 427823.73 | 447012.88 | 450964.19 | -4.3 | -5.1 |
| Total | 6620674.44 | 5965616.29 | 6179693.94 | 11.0 | 7.1 |
Source: Company website, EWL Research
Disclosure in pursuance of Section 19 of SEBI (RA) Regulation 2014
Elite Wealth Limited does/does not do business with companies covered in its research reports. Investors should be aware that the Elite Wealth Limited may/may not have a conflict of interest that could affect the objectivity of this report. Investors should consider this report as only information in making their investment decision and must exercise their own judgment before making any investment decision.
For analyst certification and other important disclosures, see the Disclosure Appendix, or go to www.elitewealth.in. Analysts employed by Elite Wealth Limited are registered/qualified as research analysts with SEBI in India.( SEBI Registration No.: INH100002300)
Disclosure Appendix
Analyst Certification (For Reports)
Vindhyachal Prasad, Elite Wealth Limited, vindhyachal@elitestock.com
The analyst(s) certify that all of the views expressed in this report accurately reflect my/our personal views about the subject company or companies and its or their securities. I/We also certify that no part of my compensation was, is or will be, directly or indirectly, related to the specific recommendations or views expressed in this report. Unless otherwise stated, the individuals listed on the cover page of this report are analysts in Elite Wealth Limited.
As to each individual report referenced herein, the primary research analyst(s) named within the report individually certify, with respect to each security or issuer that the analyst covered in the report, that:
- all of the views expressed in the report accurately reflect his or her personal views about any and all of the subject securities or issuers; and
- no part of any of the research analyst’s compensation was, is, or will be directly or indirectly related to the specific recommendations or views expressed in the For individual analyst certifications, please refer to the disclosure section at the end of the attached individual notes.
Research Excerpts
This note may include excerpts from previously published research. For access to the full reports, including analyst certification and important disclosures, investment thesis, valuation methodology, and risks to rating and price targets, please visit www.elitewealth.in.
Company-Specific Disclosures
Important disclosures, including price charts, are available and all Elite Wealth Limited covered companies by visiting https://www.elitewealth.in, or emailing research@elitestock.com with your request. Elite Wealth Limited may screen companies based on Strategy, Technical, and Quantitative Research. For important disclosures for these companies, please e-mail research@elitestock.com.
Options related research:
If the information contained herein regards options related research, such information is available only to persons who have received the proper option risk disclosure documents. For a copy of the risk disclosure documents, please contact your Broker’s Representative or visit the OCC’s website at https://www.elitewealth.in
Other Disclosures
All research reports made available to clients are simultaneously available on our client websites. Not all research content is redistributed, e-mailed or made available to third-party aggregators. For all research reports available on a particular stock, please contact your respective broker’s sales person.
Ownership and material conflicts of interest Disclosure
Elite Wealth Limited policy prohibits its analysts, professionals reporting to analysts from owning securities of an y company in the analyst’s area of coverage. Analyst compensation: Analysts are salary based permanent employees of Elite Wealth Limited. Analyst as officer or director: Elite Wealth Limited policy prohibits its analysts, persons reporting to analysts from serving as an officer, director, board member or employee of any company in the analyst’s area of coverage.
Country Specific Disclosures
India – For private circulation only, not for sale. Legal Entities Disclosures
Mr. Ravinder Parkash Seth is the Managing Director of Elite Wealth Ltd (EWL, henceforth), having its registered office at Casa Picasso, Golf Course Extension, Near Rajesh Pilot Chowk, Radha Swami, Sector-61, Gurgaon-122001 Haryana, is a SEBI registered Research Analyst and is regulated by Securities and Exchange Board of India. Telephone: 011-43035555, Facsimile: 011-22795783 and Website: www.elitewealth.in
EWL discloses all material information about itself including its business activity, disciplinary history, the terms and conditions on which it offers research report, details of associates and such other information as is necessary to take an investment decision, including the following:
- Reports
- a) EWL or his associate or his relative has no financial interest in the subject company and the nature of such financial interest;
- EWL or its associates or relatives, have no actual/beneficial ownership of one %. or more in the securities of the subject company, at the end of the month immediately preceding the date of publication of the research report or date of the public appearance;
- EWL or its associate or his relative, has no other material conflict of interest at the time of publication of the research report or at the time of public appearance;
- Compensation
- EWL or its associates have not received any compensation from the subject company in the past twelve months;
- EWL or its associates have not managed or co-managed public offering of securities for the subject company in the past twelve months;
- EWL or its associates have not received any compensation for investment banking or merchant banking or brokerage services from the subject company in the past twelve months;
- EWL or its associates have not received any compensation for products or services other than investment banking or merchant banking or brokerage services from the subject company in the past twelve months;
- EWL or its associates have not received any compensation or other benefits from the Subject Company or third party in connection with the research 3 In respect of Public Appearances
- EWL or its associates have not received any compensation from the subject company in the past twelve months;
- The subject company is not now or never a client during twelve months preceding the date of distribution of the research report and the types of services provided by EWL


