
| Recommendation | PRICE RANGE | Target Price | Time Horizon |
| Accumulate | ₹ 340 – ₹350 | Rs. 420 | 12 Months |
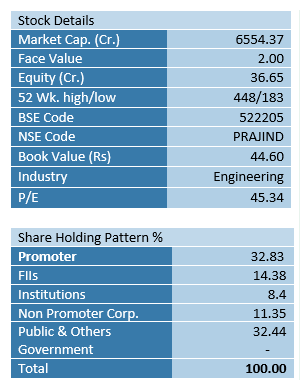
Praj Industries is one of the most reputed & technologically advanced biotech & engineering companies in India. Co has more than 1000 customer present in 100+ countries across. They are into three business segment Bioenergy (77%), Engineering (15%), HI Purity (9%). Around 83% of the revenue come from India and 17% from Export. As on Q3FY22 Praj has an order book of 2605 Crore of which 66% is from Bioenergy segment.
Key Investment Rationale
•Praj has developed advanced bio methanation technology based on proprietary microbiological pre-treatment for production of compressed biogas, they commercialized a proprietary renewable gas technology – RenGasTM &has commissioned over 40 plants in India. The process creates value-added manure with organic soil as a byproduct while advanced biogas cleaning techniques gives pure methane. As world is moving to clean energy this technology will gather more pace.
• Marine Biofuel – Marine biofuels produced from certified lignin-based feedstocks are rapidly gaining interest among international ocean shippers and carriers.
• In 2021 India has achieved highest ever Ethanol blend of 8.1% with around 90% of Ethanol supplied from Sugary feedstock, the government has hiked the price of ethanol extracted from sugarcane for by up to Rs 1.47 per litre for 2021-22. Which will also utilize excess sugar in the country On International front company is seeing good momentum in capacity building in North and South America.
• Bio Syrup is witnessing good response on initial levels in Brazil. Praj’s commercial demo facility for production of Ethanol from BIOSYRUP has been successfully implemented in M/s Jaywant Sugars. BIOSYRUP was stored for the period of one year and no sugar loss was observed even after the period of 12 months. The technology has been validated and certified Vasantdada Sugar Institute (VSI) – India’s premier sugar research institution.
• Continued Strong Demand for Domestic Grain based 1G Ethanol plants: During Q2 FY22 ~118 Cr Liters of capacity was ordered built in the country of which ~94 cr liters was for Grain based capacity(starchy feedstock) indicating momentum in Grain based distilleries, this will ensure wide spread of Ethanol across country and help in achieving EBP targets. During the Q3 quarter company received orders worth 433 Cr from grain based distilleries.
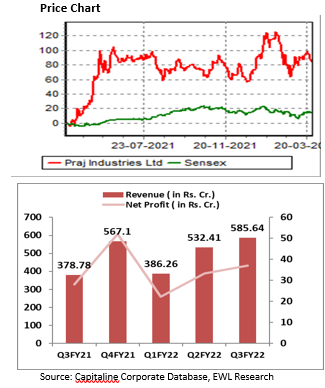
• Praj Reported very strong Revenue growth of 68% YoY in Q3FY22, EBITDA was up 28% , EBITDA Margin was impacted by high material cost which came in at 8.71%.PAT was up 31.6% at ₹37.1 crore.
• Praj has a very strong order book of ₹ 2605 Cr, out of which 956 cr order came in Q3FY22, of the total order 78% is from domestic sector and 22% is from Export market. Execution is improving for the company
Outlook:
Praj is witnessing strong growth in its key segment Bio Energy in Domestic business, as government is pushing for ethanol blending from 10% to 20% in FY25, and Praj being a key player in Ethanol plant is going to be a beneficiary, the overall demand-supply gap of Ethanol, increased interest in grain based distilleries and decarbonisation impetus is auguring well for Praj along with development in other key verticals such as Biosyrups, High Purity gaining traction. Praj is a key beneficiary of multiple tailwinds from ethanol bleeding to bio energy. We expect a robust Revenue growth of 25% in Q4FY22 but margins are expected to fall due to high material cost, profit is expected to degrow 9% in this quarter, but seeing the long term growth visibility we recommend ACCUMULATE IN THE PRICE RANGE OF ₹340-355 on the company, valuing the company on 40x FY23 earning we recommend BUY for the target price of ₹420.
| Profit And Loss | Yearly | Quarter | Quarter | Quarter | Quarter |
| 31-03-2022E | 31-03-2022E | 31-12-2021 | 30-09-2021 | 30-06-2021 | |
| Net Sales | 2213 | 709 | 586 | 532 | 386 |
| Other Income | 29 | 13 | 5 | 7 | 5 |
| Total Income | 2243 | 722 | 591 | 539 | 391 |
| Expenditure | |||||
| Raw Materials | 1374 | 445 | 359 | 334 | 237 |
| Power & Fuel Cost | 10 | 4 | 3 | 2 | 2 |
| Employee Cost | 213 | 54 | 59 | 56 | 44 |
| Other Manufacturing Expenses | 245 | 90 | 63 | 51 | 42 |
| Selling and Administration Expenses | 132 | 49 | 33 | 28 | 22 |
| Miscellaneous Expenses | 64 | 23 | 19 | 14 | 8 |
| Total Expenditure | 2040 | 663 | 535 | 486 | 356 |
| EBIDTA | 203 | 58 | 56 | 53 | 36 |
| Interest | 2 | 1 | 1 | 1 | 1 |
| EBDT | 200 | 58 | 55 | 52 | 35 |
| Depreciation | 21 | 5 | 5 | 5 | 5 |
| EBT | 179 | 53 | 50 | 47 | 30 |
| Tax | 39 | 11 | 11 | 12 | 5 |
| Deferred Tax | 7 | 1 | 3 | 1 | 3 |
| Profit After Tax | 133 | 41 | 37 | 33 | 22 |
| EPS | 7.62 | 2.57 | 2.02 | 1.82 | 1.21 |
| Balance Sheet | 2022E | 2021 | 2020 | 2019 |
| Net Block | 210 | 207 | 219 | 215 |
| Goodwill | 64 | 63 | 63 | 64 |
| Total Non-Current Assets | 381 | 358 | 382 | 386 |
| cash | 67 | 101 | 46 | 64 |
| Inventory | 237 | 129 | 111 | 126 |
| Receivables | 589 | 453 | 330 | 305 |
| Investments | 290 | 295 | 124 | 166 |
| Other current Assets | 287 | 257 | 169 | 200 |
| Total Assets | 1851 | 1594 | 1162 | 1247 |
| Share Capital | 37 | 37 | 37 | 37 |
| Reserve & Surplus | 858 | 765 | 683 | 708 |
| Total Equity | 895 | 803 | 720 | 746 |
| Total Non-current liabilities | 28 | 27 | 32 | 16 |
| Trade payable | 469 | 342 | 187 | 235 |
| Other Current liabilities | 460 | 423 | 222 | 251 |
| Total Current Liabilities | 1851 | 1594 | 1162 | 1247 |
| Cash Flow Statement | 2022E | 2021 | 2020 | 2019 |
| Net Profit Before Tax | 179 | 113 | 83 | 88 |
| Depreciation | 21 | 22 | 22 | 23 |
| Working Capital Change | (158) | 116 | (76) | (37) |
| Tax Paid | (39) | (15) | (18) | (21) |
| Cash Flow From Operating Activity | 3 | 236 | 15 | 54 |
| Cash Flow From Investing Activity | 2 | (164) | 62 | (3) |
| Cash Flow From Financing Activity | (40) | (6) | (98) | (43) |
| Change in Cash | (34) | 66 | (21) | 7 |
| Opening Cash | 101 | 46 | 64 | 57 |
| Closing Cash | 67 | 101 | 46 | 64 |
| I. Solvency Ratios | 2022E | 2021 | 2020 | 2019 |
| Current ratio | 1.58 | 1.62 | 1.91 | 1.77 |
| Quick ratio | 0.69 | 0.85 | 0.83 | 0.88 |
| Cash ratio | 0.11 | 0.17 | 0.12 | 0.18 |
| Total Debt/Equity | – | – | – | – |
| Total Asset/Equity | 2.07 | 1.99 | 1.61 | 1.67 |
| Sales | 2213 | 1304.67 | 1102.37 | 1141.11 |
| COGS | 1384.90 | 736.82 | 573.17 | 607.06 |
| COGS % | 63% | 56% | 52% | 53% |
| II. Turnover Ratios | 2022 | 2021 | 2020 | 2019 |
| Receivables Turnover | 4.81x | 3.33x | 3.47x | 3.74x |
| Payables Turnover | 4.17x | 2.79x | 2.72x | 2.59x |
| Inventories Turnover | 9.34x | 6.14x | 4.83x | 4.80x |
| Average Receivables collection period | 75.9 Days | 109.6 Days | 105.2 Days | 97.7 Days |
| Average Payable Days (payment period) | 87.6 Days | 131.1 Days | 134.4 Days | 141.0 Days |
| Inventories Days | 39.1 Days | 59.5 Days | 75.6 Days | 76.0 Days |
| Cash Collection Cycle | 27.4 Days | 38.0 Days | 46.4 Days | 32.6 Days |
| III. Operating Efficiency | 2022 | 2021 | 2020 | 2019 |
| Total asset turnover (Sales / Average Assets) | 1.29 | 0.95 | 0.92 | 1.83 |
| Net fixed asset turnover | 8.11 | 4.83 | 3.94 | 4.13 |
| Equity turnover | 2.61 | 1.71 | 1.50 | 1.53 |
| IV. Return Ratio | 2022 | 2021 | 2020 | 2019 |
| ROA | 7.75% | 5.87% | 5.50% | 9.62% |
| ROE | 15.73% | 10.62% | 9.03% | 8.06% |
(E=Estimate)
Disclosure in pursuance of Section 19 of SEBI (RA) Regulation 2014
Elite Wealth Limited does/does not do business with companies covered in its research reports. Investors should be aware that the Elite Wealth Limited may/may not have a conflict of interest that could affect the objectivity of this report. Investors should consider this report as only information in making their investment decision and must exercise their own judgment before making any investment decision.
For analyst certification and other important disclosures, see the Disclosure Appendix, or go to www.elitewealth.in. Analysts employed by Elite Wealth Limited are registered/qualified as research analysts with SEBI in India.( SEBI Registration No.: INH100002300)
Disclosure Appendix
Analyst Certification (For Reports)
Israil Khan, Elite Wealth Limited, suhail@elitewealth.in
The analyst(s) certify that all of the views expressed in this report accurately reflect my/our personal views about the subject company or companies and its or their securities. I/We also certify that no part of my compensation was, is or will be, directly or indirectly, related to the specific recommendations or views expressed in this report. Unless otherwise stated, the individuals listed on the cover page of this report are analysts in Elite Wealth Limited.
As to each individual report referenced herein, the primary research analyst(s) named within the report individually certify, with respect to each security or issuer that the analyst covered in the report, that:
(1) all of the views expressed in the report accurately reflect his or her personal views about any and all of the subject securities or issuers; and
(2) no part of any of the research analyst’s compensation was, is, or will be directly or indirectly related to the specific recommendations or views expressed in the report.
For individual analyst certifications, please refer to the disclosure section at the end of the attached individual notes.
Research Excerpts
This note may include excerpts from previously published research. For access to the full reports, including analyst certification and important disclosures, investment thesis, valuation methodology, and risks to rating and price targets, please visit www.elitewealth.in.
Company-Specific Disclosures
Important disclosures, including price charts, are available and all Elite Wealth Limited covered companies by visiting https://www.elitewealth.in, or emailing research@elitestock.com with your request. Elite Wealth Limited may screen companies based on Strategy, Technical, and Quantitative Research. For important disclosures for these companies, please e-mail research@elitestock.com.
Options related research:
If the information contained herein regards options related research, such information is available only to persons who have received the proper option risk disclosure documents. For a copy of the risk disclosure documents, please contact your Broker’s Representative or visit the OCC’s website at https://www.elitewealth.in
Other Disclosures
All research reports made available to clients are simultaneously available on our client websites. Not all research content is redistributed, e-mailed or made available to third-party aggregators. For all research reports available on a particular stock, please contact your respective broker’s sales person.
Ownership and material conflicts of interest Disclosure
Elite Wealth Limited policy prohibits its analysts, professionals reporting to analysts from owning securities of any company in the analyst’s area of coverage. Analyst compensation: Analysts are salary based permanent employees of Elite Wealth Limited. Analyst as officer or director: Elite Wealth Limited policy prohibits its analysts, persons reporting to analysts from serving as an officer, director, board member or employee of any company in the analyst’s area of coverage.
Country Specific Disclosures
India – For private circulation only, not for sale.
Legal Entities Disclosures
Mr. Ravinder Parkash Seth is the Managing Director of Elite Wealth Ltd (EWL, henceforth), having its registered office at Casa Picasso, Golf Course Extension, Near Rajesh Pilot Chowk, Radha Swami, Sector-61, Gurgaon-122001 Haryana, is a SEBI registered Research Analyst and is regulated by Securities and Exchange Board of India. Telephone:011-43035555, Facsimile: 011-22795783 and Website: www.elitewealth.in
EWL discloses all material information about itself including its business activity, disciplinary history, the terms and conditions on which it offers research report, details of associates and such other information as is necessary to take an investment decision, including the following:
1. Reports
a) EWL or his associate or his relative has no financial interest in the subject company and the nature of such financial interest;
(b) EWL or its associates or relatives, have no actual/beneficial ownership of one per cent. or more in the securities of the subject company, at the end of the month immediately preceding the date of publication of the research report or date of the public appearance;
(c) EWL or its associate or his relative, has no other material conflict of interest at the time of publication of the research report or at the time of public appearance;
2. Compensation
(a) EWL or its associates have not received any compensation from the subject company in the past twelve months;
(b) EWL or its associates have not managed or co-managed public offering of securities for the subject company in the past twelve months;
(c) EWL or its associates have not received any compensation for investment banking or merchant banking or brokerage services from the subject company in the past twelve months;
(d) EWL or its associates have not received any compensation for products or services other than investment banking or merchant banking or brokerage services from the subject company in the past twelve months;
(e) EWL or its associates have not received any compensation or other benefits from the Subject Company or third party in connection with the research report.
3 In respect of Public Appearances
(a) EWL or its associates have not received any compensation from the subject company in the past twelve months;
(b) The subject company is not now or never a client during twelve months preceding the date of distribution of the research report and the types of services provided by EWL