
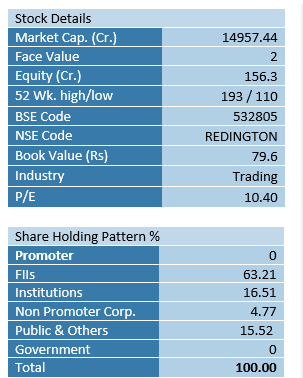
| Recommendation | PRICE RANGE | Target Price | Time Horizon |
| Accumulate | ₹ 175- CMP | Rs. 250 | 12 Months |
Redington India Ltd. is a leading supply chain solutions provider in the world, providing solutions to all categories of Information Technology, Telecom, Cloud, Lifestyle and Solar segment. The key business verticals of the company are Distribution, Services, Logistics Services and Emerging Businesses. It is a completely professionally managed company with no promoters and has expansive network of over 290+ brands association and 43,000+ channel partners and is currently serving to 38 emerging markets.
Key Investment Rationale:
• Redington is continuously focusing on the Cloud and IT service and has made a significant partnership with Google Cloud India to drive the cloud based services amongst the small and medium businesses (SMBs) in the country. This tie-up is worth noting as the public cloud services market is likely to register a CAGR of 24%, and reach $13.5 billion by 2026, as per recent estimates by research firm International Data Corporation (IDC).
• The company’s solar business unit has recently made partnership with Enertech, a leading manufacturer of Solar Hybrid Inverter based in India to cater the rising demand in solar hybrid invertors in India.
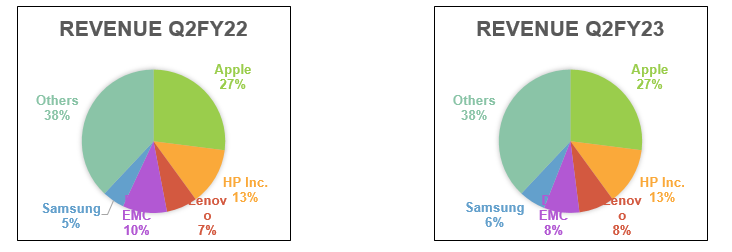
• It has all major brands association of the world be it Google, Apple, Microsoft, HP, Dell, Amazon, Canon, Xiaomi, IBM etc. Top 5 vendors of the company are Apple, HP Inc., Lenovo, Dell and Samsung which have contributed 27%, 13%, 8%, 8% and 6% respectively in the earnings of Q2FY23.
• As the supply chain of the world is getting restored, Redington’s logistics business `Proconnect’ is also seeing a good turnover and growth. Company further expects the demand environment to be better in the categories like data centers, cloud service and other services, accessories and some mobility products.
• Recently Redington was appointed as the National distributor for Policab India’s passive networking solutions. The strong presence and solution centric mechanism of Redington would support the Policab to reach its customer base effectively.
• The company gets indirect benefit of the government’s Production Linked Incentive Scheme (PLI) for Electronics Manufacturing as it reduces imports and distributes more homemade products and is supporting the Make in India movement in the country.
Business Overview:
Redington’s core offerings comprises: Distribution, Services, Logistics Services and Emerging Businesses.
Distribution: Company is the leading technology distributor and customized solution provider in India catering to different customer segments. It offers networking solution, enterprise server & storage solution, security solution, software solution and licensing & subscription to enterprises. It offers various IT products to customers such as PCs, tablets & phablets, printers & other accessories. In the telecom segment, company is distributing smartphones including premium brands, Augmented Reality/Virtual Reality-Powered Wearables. Redington is also providing value-added services such as pre-sales, marketing, credit, logistics and training for channel partners.
Services: It is providing bouquet of cloud services to organizations for the ease of doing their businesses; cloud consulting, cloud migration, cloud integration and cloud security are some of these. Apart from cloud services, company is also in the 3D printing and 3D scanning industry, where it offers automotive design prototyping and part production under the name Visuali.
Logistics Services: Redington operates its logistics business through ProConnect Supply Chain Solutions Limited, which has been formed as a separate company in 2012. It provides logistics for products across various verticals like FMCG, Telecom, Lifestyle, Food products, Consumer goods, Engineering, IT Hardware, and Non-Hazardous Chemicals etc. Third party logistics, reverse logistics, in-plant logistics management, supply chain consulting are some of the solutions offered by the company under this segment.
Company is introducing automation and technology intervention in the Proconnect and is making this segment as a Logitech provider. It had generated Rs.140 Cr. in the September quarter and expect is to be around Rs.1000 Cr. in the next three years.
Emerging Business: The Company is diversifying into Health & Medical equipment and Solar energy business, where it uses its vast distribution network to reach to the last mile consumers.
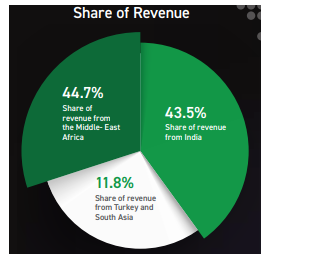
Revenue Share in FY2022
Industry Overview:
The IT industry is the one of the few industries which saw growth amidst the pandemic due to the sudden demand of remote work; the global IT industry is further expected to rise to US$ 4.5 trillion in 2022, an increase of 5% from 2021.
In India, information and communication technology sector comprises 13% of the GDP. The adoption of hybrid work culture across the country drive the demand in 2022 and the spending on devices increased by 7.5% from 2021. India is the topmost preferred destination for the IT companies worldwide; Emerging technologies are now opening the wide spectrum of opportunities for these companies. The Indian IT and Business services market is expected to reach US$ 19.93 billion by 2025.
Consumer IT segment is growing worldwide due to increasing demand for personal computers and smartphones despite the supply disruptions. Total PC (includes desktops, notebooks and workstations) shipments increased by 14.8% from 2020 and reached to 348.8 million units in 2021. In India the PC market show a growth of 44.5% YoY in 2021 with 18.6 million units sold in the year. As the global supply chain is easing there will be stronger demand from SMBs and enterprise customers in the segment. A major opportunity for the PCs supplier is the education sector as the PC ownership ratio for student remains low in India.
Key Triggers:
Partnerships with Industry leaders: Redington has been the largest supplier of the products of Apple inc. in the country and the recent partnership with Google Cloud India to focus on the cloud services for the SMBs shows the confidence that big tech companies have on the company.
Emerging Tech Industry: The technology trend is changing enormously worldwide. Security solutions, Cloud services, Artificial Intelligence, Machine learning and Data Analysis are some major tech trends for the coming future and the company is further planning to invest in these key trends.
Revenue from Cloud and Cloud managed services grew significantly by 67% in the September quarter, 2022. Many organizations are bringing cloud solutions to their businesses and due to this the global cloud computing market is expected to register a CAGR of 15.7% by 2030.
Government initiatives: India is currently the second largest manufacturer of mobile handsets in the world and this market is expected to grow at a CAGR of 10.5% by 2028. Atmanirbhar Bharat scheme and duty concession will strengthen the local manufacturing. Further the government’s commitment of 5G roll out by 2023 will be a major booster for the industry. Apart from this PM Gati Shakti will increase the supply chain efficiencies.
Financials:
Quarterly Performance:
| Particulars (in Rs. Cr.) | 202209 | 202206 | QoQ (%) | 202109 | YoY (%) |
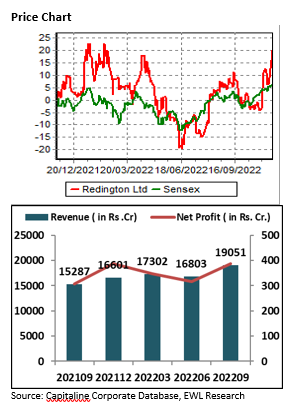
| Revenue from Operations | 19050.74 | 16803.14 | 13.4% | 15287.46 | 24.6% |
| Other Income | 30.04 | 25.18 | 19.3% | 25.86 | 16.2% |
| Total Income | 19080.78 | 16828.32 | 13.4% | 15313.32 | 24.6% |
| Employee Expenses | 278.45 | 285.01 | -2.3% | 209.55 | 32.9% |
| Other Expenses | 385.18 | 298.18 | 29.2% | 252.3 | 52.7% |
| Total Expenditure | 18518.33 | 16341.32 | 13.3% | 14855.85 | 24.7% |
| EBITDA | 562.45 | 487 | 15.6% | 457.47 | 22.9% |
| EBITDA (%) | 2.95 | 2.9 | 5 bps | 2.99 | -4 bps |
| Depreciation | 37.12 | 36.48 | 1.8% | 36.08 | 2.9% |
| EBIT | 525.33 | 450.52 | 16.6% | 421.39 | 24.7% |
| Interest | 54.48 | 36.84 | 47.9% | 30.66 | 77.7% |
| PBT | 470.85 | 413.68 | 13.8% | 390.73 | 20.5% |
| Tax | 83.96 | 90.28 | -7.0% | 68.95 | 21.8% |
| Deferred Tax | -5.02 | -2.94 | 70.7% | -1.31 | 283.2% |
| Profit After Tax (PAT) | 391.91 | 326.34 | 20.1% | 323.09 | 21.3% |
| PATM (%) | 2.06 | 1.94 | 12 bps | 2.11 | -5 bps |
| EPS (in Rs.) | 4.95 | 4.04 | 22.5% | 3.93 | 26.0% |
| EPS TTM (in Rs.) | 18.42 | 17.4 | 5.9% | 10.56 | 74.4% |
Extract of Q2FY23 Earnings:
-
The company generated highest ever half year revenue growth at 25%.
-
It is continuously showing strong financial performance; On the Global basis, Revenue of the company grew by 25% YoY and reached to 19,080 Cr. in Q2FY23. While SISA (Singapore, India and South Asia) Revenue grew 23% YoY and ROW (Rest of the World) Revenue grew by 26% YoY.
-
EBITDA and PAT grew 23% and 26% respectively due to the solid business execution across geographies.
-
SISA contributed 52% in the revenue and the rest 48% was contributed by the ROW.
-
On the global basis, IT segment revenue of the company has shown de-growth of 2 bps yearly and contributed 74% in the revenue. The mobility segment revenue percentage has increased by 2 bps yearly and contributed 25% and services segment revenue remained same and contributed 1% in the September quarter.
-
Despite of macroeconomic headwinds business of the company is continuously growing. India, Middle East and Africa, Turkey and South Asia have shown strong growth.
-
Demand in the consumer IT subdued due to back to office and schools reopening. This was balanced out by the demand from enterprises and SMBs.
-
Working Capital days of the company was 27 days. ROCE and ROE was 35% and 25% respectively.
Revenue % from top 5 Vendors:
Management Commentary:
-
The management expects constrained demand in consumer IT products which are PCs, printers, work from home and learn from home products.
-
The demand environment of the categories like data centers, clouds, services, accessories and some mobility products would upturn.
-
Proconnect – the logistics business of the company seen a good turnover and stabilization and growth. Revenue from the segment was Rs.140 Cr., a 7% growth YoY and is expected to be Rs.1000 Cr. in the next three years.
-
The enablement of 5G network in the coming months would fuel the demand in the IT and mobility space.
-
The cloud business revenue was Rs.506 Cr. and cloud managed services was at Rs.21 Cr.
-
The working capital cycle for the September quarter was at the lowest range of 27-35 days as guided by the management in the June quarter. The consumer IT demand was softer and the company had higher inventory buildup but for the Enterprise products demand, company got partial shipments because of the supply shortage. The management believes these issues will get resolved and the WC days would remain in the range in the coming quarters.
-
The PC industry in September quarter has gone down by 15% and the whole industry has gone down by 9% but the gain in market share in new geographies and expansion in new categories of products in the same and new geographies has helped the company besides the slowdown.
-
Management is focusing on delivering double–digit growth and outpace the market growth. Company believe to grow at 25% from a growth perspective.
-
The company is focusing to expand its footprint more in the Southeast Asia, African countries, more countries of Middle East and Eastern Europe.
Balance Sheet:
| Particulars | 2022 | 2021 | 2020 |
| SOURCES OF FUNDS : | |||
| Share Capital | 156.29 | 77.84 | 77.82 |
| Reserves Total | 5628.66 | 4860.67 | 4231.03 |
| Total Shareholders’ Funds | 5784.95 | 4938.51 | 4308.85 |
| Minority Interest | 322.75 | 372.97 | 381.27 |
| Secured Loans | 205.03 | 50.31 | 1672.22 |
| Unsecured Loans | 625.73 | 571.6 | 1102.49 |
| Total Debt | 830.76 | 621.91 | 2774.71 |
| Other Liabilities | 169.26 | 133.55 | 125.14 |
| Total Liabilities | 7107.72 | 6066.94 | 7589.97 |
| APPLICATION OF FUNDS : | |||
| Gross Block | 1121.24 | 972.04 | 1054.18 |
| Less: Accumulated Depreciation | 421.16 | 367.26 | 339.76 |
| Net Block | 700.08 | 604.78 | 714.42 |
| Capital Work in Progress | 85.39 | 0.94 | 11.47 |
| Investments | 0 | 0 | 0 |
| Current Assets, Loans & Advances | |||
| Inventories | 4383.04 | 2902.11 | 3672.76 |
| Sundry Debtors | 8675.16 | 6800.67 | 7032 |
| Cash and Bank | 3659.3 | 3492.97 | 2377.08 |
| Loans and Advances | 641.88 | 504.31 | 571.82 |
| Total Current Assets | 17359.38 | 13700.06 | 13653.66 |
| Less : Current Liabilities and Provisions | |||
| Current Liabilities | 11106.58 | 8325.4 | 6946.88 |
| Provisions | 193.13 | 166.78 | 114.48 |
| Total Current Liabilities | 11299.71 | 8492.18 | 7061.36 |
| Net Current Assets | 6059.67 | 5207.88 | 6592.3 |
| Deferred Tax Assets | 40.13 | 32.08 | 30.96 |
| Deferred Tax Liabilities | 10.12 | 3.71 | 5.91 |
| Net Deferred Tax | 30.01 | 28.37 | 25.05 |
| Other Assets | 232.57 | 224.97 | 246.73 |
| Total Assets | 7107.72 | 6066.94 | 7589.97 |
| Contingent Liabilities | 147.41 | 171.4 | 198.51 |
Cash Flow Statement:
| Particulars | 2022 | 2021 | 2020 |
| Cash Flow Summary: | |||
| Cash and Cash Equivalents at Beginning of the year | 2925.26 | 2279.3 | 816.11 |
| Net Cash from Operating Activities | 989.2 | 3496.89 | 965.65 |
| Net Cash Used in Investing Activities | -166.97 | -609.88 | 54.28 |
| Net Cash Used in Financing Activities | -476.11 | -2241.05 | 443.26 |
| Net Inc/(Dec) in Cash and Cash Equivalent | 346.12 | 645.96 | 1463.19 |
| Cash and Cash Equivalents at End of the year | 3271.38 | 2925.26 | 2279.3 |
Key Ratios:
| 2022 | 2021 | 2020 | |
| Debt-Equity Ratio | 0.14 | 0.37 | 0.5 |
| Long Term Debt-Equity Ratio | 0.03 | 0.03 | 0.02 |
| Current Ratio | 1.49 | 1.47 | 1.43 |
| Turnover Ratios | |||
| Fixed Assets | 59.85 | 56.21 | 58.47 |
| Inventory | 17.2 | 17.32 | 13.67 |
| Debtors | 8.1 | 8.23 | 7.73 |
| Total Asset Turnover Ratio | 9.51 | 8.34 | 7.77 |
| Interest Cover Ratio | 10.97 | 6.51 | 3.4 |
| PBIDTM (%) | 3.08 | 2.6 | 2.21 |
| PBITM (%) | 2.85 | 2.34 | 1.91 |
| PBDTM (%) | 2.82 | 2.24 | 1.65 |
| CPM (%) | 2.32 | 1.64 | 1.34 |
| APATM (%) | 2.1 | 1.38 | 1.04 |
| ROCE (%) | 28.61 | 20.66 | 15.66 |
| RONW (%) | 24.52 | 17.05 | 13 |
| Payout (%) | 34.46 | 0 | 66.11 |
Outlook:
Redington India Ltd. is emerging as the leading distributor for IT hardware and mobility products and providing complete platform for cloud solutions. It is also building India’s channel ecosystem for harnessing solar energy. The company has shown strong financial performance over the years with Revenue CAGR of 6.8% and PAT CAGR of 35.1% from FY20 to FY22. It generated 44% revenue from India and 56% from Overseas in FY22 which was 40% and 60% from India and Overseas respectively. The company is expanding into new emerging geographies and also diversifying into solar and cloud service business. Also company is enhancing presence in the logistics business in India and the Gulf which will further support the growth of the company. The business alignment with the demand of emerging technologies and solutions would be another key driver. Currently Redington is trading at the PE of 10.40 times which looks attractive. Hence, we recommend to accumulate the stock from Rs.175 to Current Market Price with the Target Price of Rs.250 for the time period of 12 months.
Disclosure in pursuance of Section 19 of SEBI (RA) Regulation 2014
Elite Wealth Limited does/does not do business with companies covered in its research reports. Investors should be aware that the Elite Wealth Limited may/may not have a conflict of interest that could affect the objectivity of this report. Investors should consider this report as only information in making their investment decision and must exercise their own judgment before making any investment decision.
For analyst certification and other important disclosures, see the Disclosure Appendix, or go to www.elitewealth.in. Analysts employed by Elite Wealth Limited are registered/qualified as research analysts with SEBI in India.( SEBI Registration No.: INH100002300)
Disclosure Appendix
Analyst Certification (For Reports)
Israil Khan, Elite Wealth Limited, suhail@elitewealth.in
The analyst(s) certify that all of the views expressed in this report accurately reflect my/our personal views about the subject company or companies and its or their securities. I/We also certify that no part of my compensation was, is or will be, directly or indirectly, related to the specific recommendations or views expressed in this report. Unless otherwise stated, the individuals listed on the cover page of this report are analysts in Elite Wealth Limited.
As to each individual report referenced herein, the primary research analyst(s) named within the report individually certify, with respect to each security or issuer that the analyst covered in the report, that:
(1) all of the views expressed in the report accurately reflect his or her personal views about any and all of the subject securities or issuers; and
(2) no part of any of the research analyst’s compensation was, is, or will be directly or indirectly related to the specific recommendations or views expressed in the report.
For individual analyst certifications, please refer to the disclosure section at the end of the attached individual notes.
Research Excerpts
This note may include excerpts from previously published research. For access to the full reports, including analyst certification and important disclosures, investment thesis, valuation methodology, and risks to rating and price targets, please visit www.elitewealth.in.
Company-Specific Disclosures
Important disclosures, including price charts, are available and all Elite Wealth Limited covered companies by visiting https://www.elitewealth.in, or emailing research@elitestock.com with your request. Elite Wealth Limited may screen companies based on Strategy, Technical, and Quantitative Research. For important disclosures for these companies, please e-mail research@elitestock.com.
Options related research:
If the information contained herein regards options related research, such information is available only to persons who have received the proper option risk disclosure documents. For a copy of the risk disclosure documents, please contact your Broker’s Representative or visit the OCC’s website at https://www.elitewealth.in
Other Disclosures
All research reports made available to clients are simultaneously available on our client websites. Not all research content is redistributed, e-mailed or made available to third-party aggregators. For all research reports available on a particular stock, please contact your respective broker’s sales person.
Ownership and material conflicts of interest Disclosure
Elite Wealth Limited policy prohibits its analysts, professionals reporting to analysts from owning securities of any company in the analyst’s area of coverage. Analyst compensation: Analysts are salary based permanent employees of Elite Wealth Limited. Analyst as officer or director: Elite Wealth Limited policy prohibits its analysts, persons reporting to analysts from serving as an officer, director, board member or employee of any company in the analyst’s area of coverage.
Country Specific Disclosures
India – For private circulation only, not for sale.
Legal Entities Disclosures
Mr. Ravinder Parkash Seth is the Managing Director of Elite Wealth Ltd (EWL, henceforth), having its registered office at Casa Picasso, Golf Course Extension, Near Rajesh Pilot Chowk, Radha Swami, Sector-61, Gurgaon-122001 Haryana, is a SEBI registered Research Analyst and is regulated by Securities and Exchange Board of India. Telephone:011-43035555, Facsimile: 011-22795783 and Website: www.elitewealth.in
EWL discloses all material information about itself including its business activity, disciplinary history, the terms and conditions on which it offers research report, details of associates and such other information as is necessary to take an investment decision, including the following:
1. Reports
a) EWL or his associate or his relative has no financial interest in the subject company and the nature of such financial interest;
(b) EWL or its associates or relatives, have no actual/beneficial ownership of one per cent. or more in the securities of the subject company, at the end of the month immediately preceding the date of publication of the research report or date of the public appearance;
(c) EWL or its associate or his relative, has no other material conflict of interest at the time of publication of the research report or at the time of public appearance;
2. Compensation
(a) EWL or its associates have not received any compensation from the subject company in the past twelve months;
(b) EWL or its associates have not managed or co-managed public offering of securities for the subject company in the past twelve months;
(c) EWL or its associates have not received any compensation for investment banking or merchant banking or brokerage services from the subject company in the past twelve months;
(d) EWL or its associates have not received any compensation for products or services other than investment banking or merchant banking or brokerage services from the subject company in the past twelve months;
(e) EWL or its associates have not received any compensation or other benefits from the Subject Company or third party in connection with the research report.
3 In respect of Public Appearances
(a) EWL or its associates have not received any compensation from the subject company in the past twelve months;
(b) The subject company is not now or never a client during twelve months preceding the date of distribution of the research report and the types of services provided by EWL